How Bangor University students increase their understanding of sedimentation with Nortek
- User stories
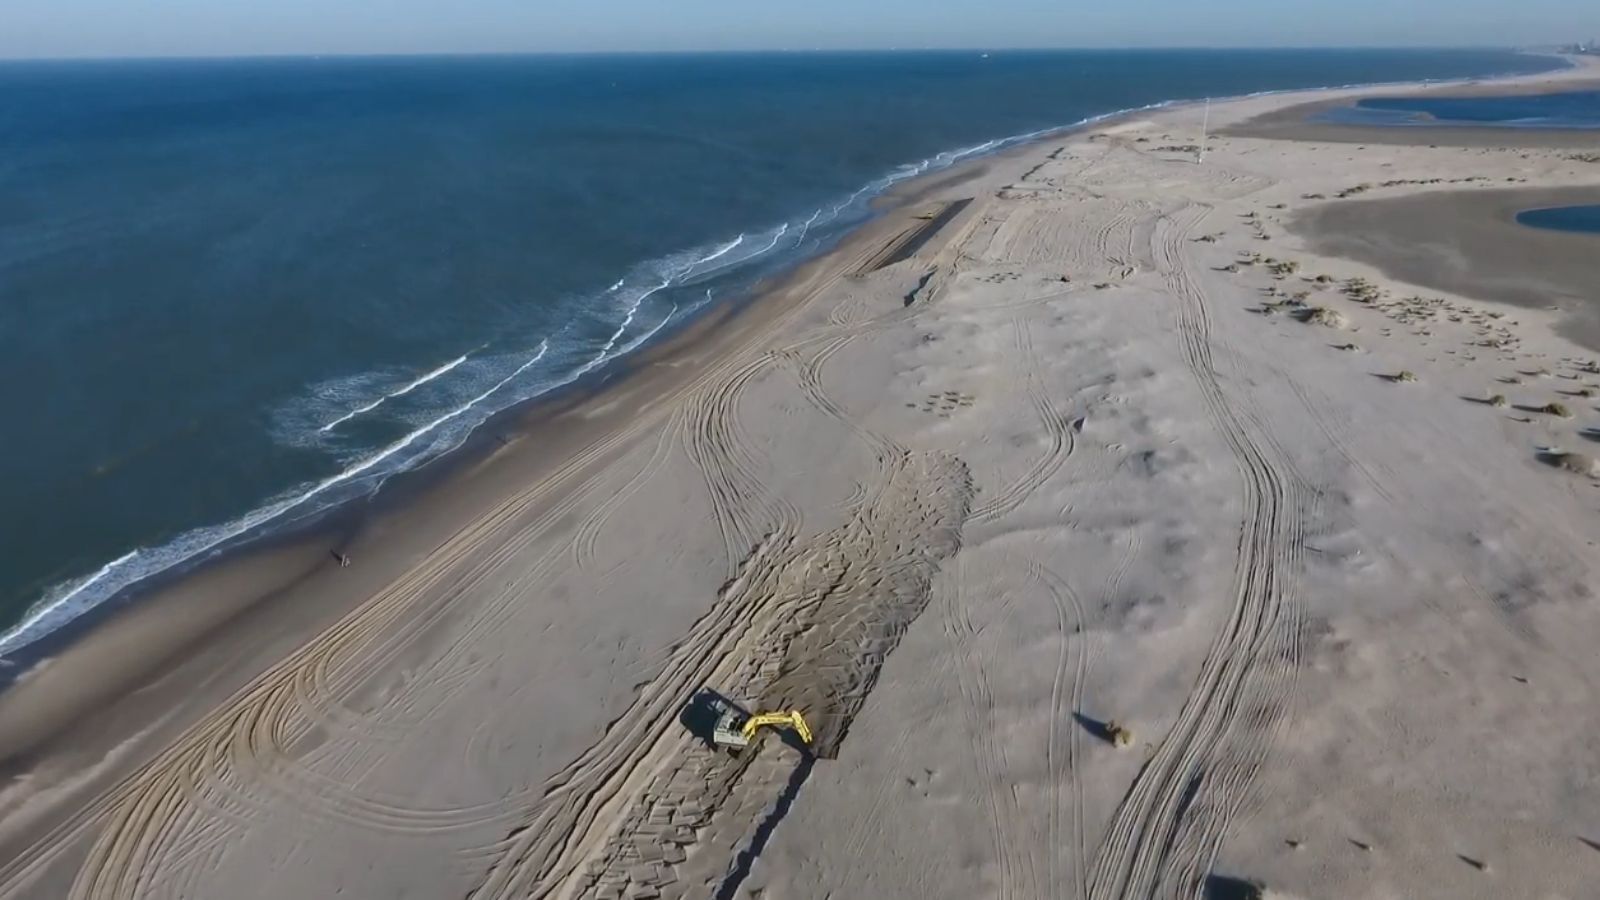
Survey data, collected by successive generations of students over this period, indicate that the estuary is infilling with fine marine sand at a rate of 1–2 cm per year.
The sediment transport results primarily from strong asymmetric tidal currents causing the influx of sand from Carmarthen Bay on the dominant flood tide.
Additionally, locally generated wind waves in the shallow estuary may contribute at different frequencies and complicate the overall picture. A newly introduced exercise utilizing Nortek’s Doppler instrumentation is helping the students to understand the processes behind this long-term trend in sedimentation.
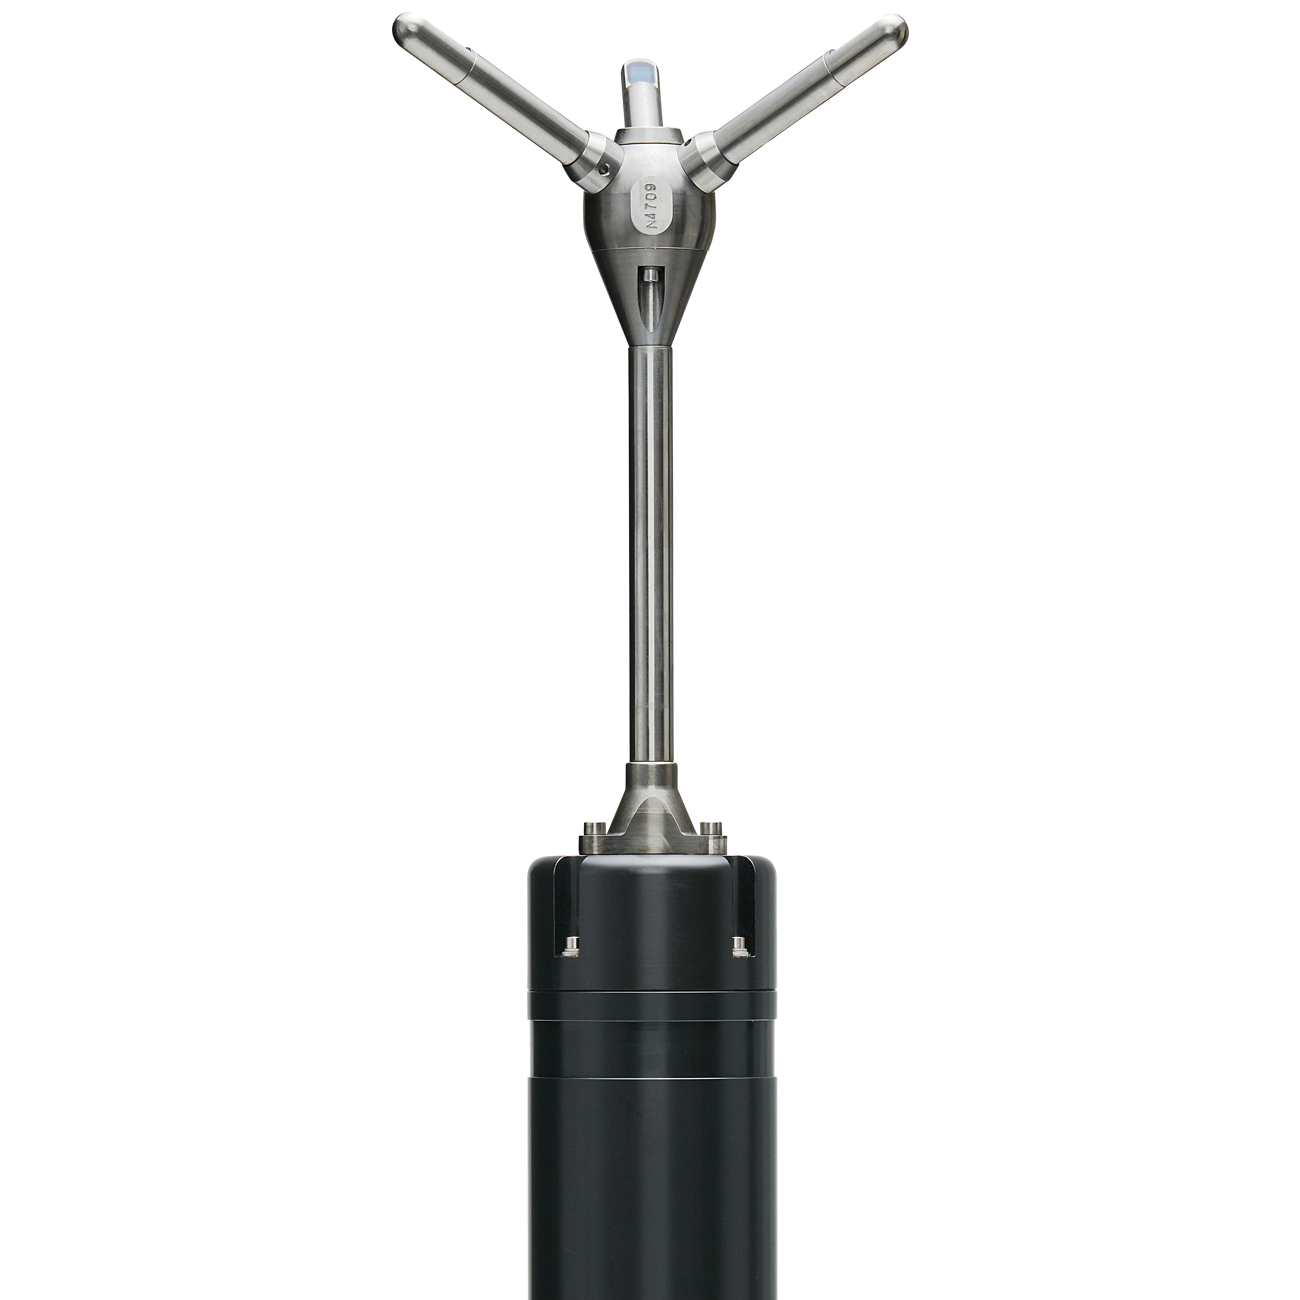
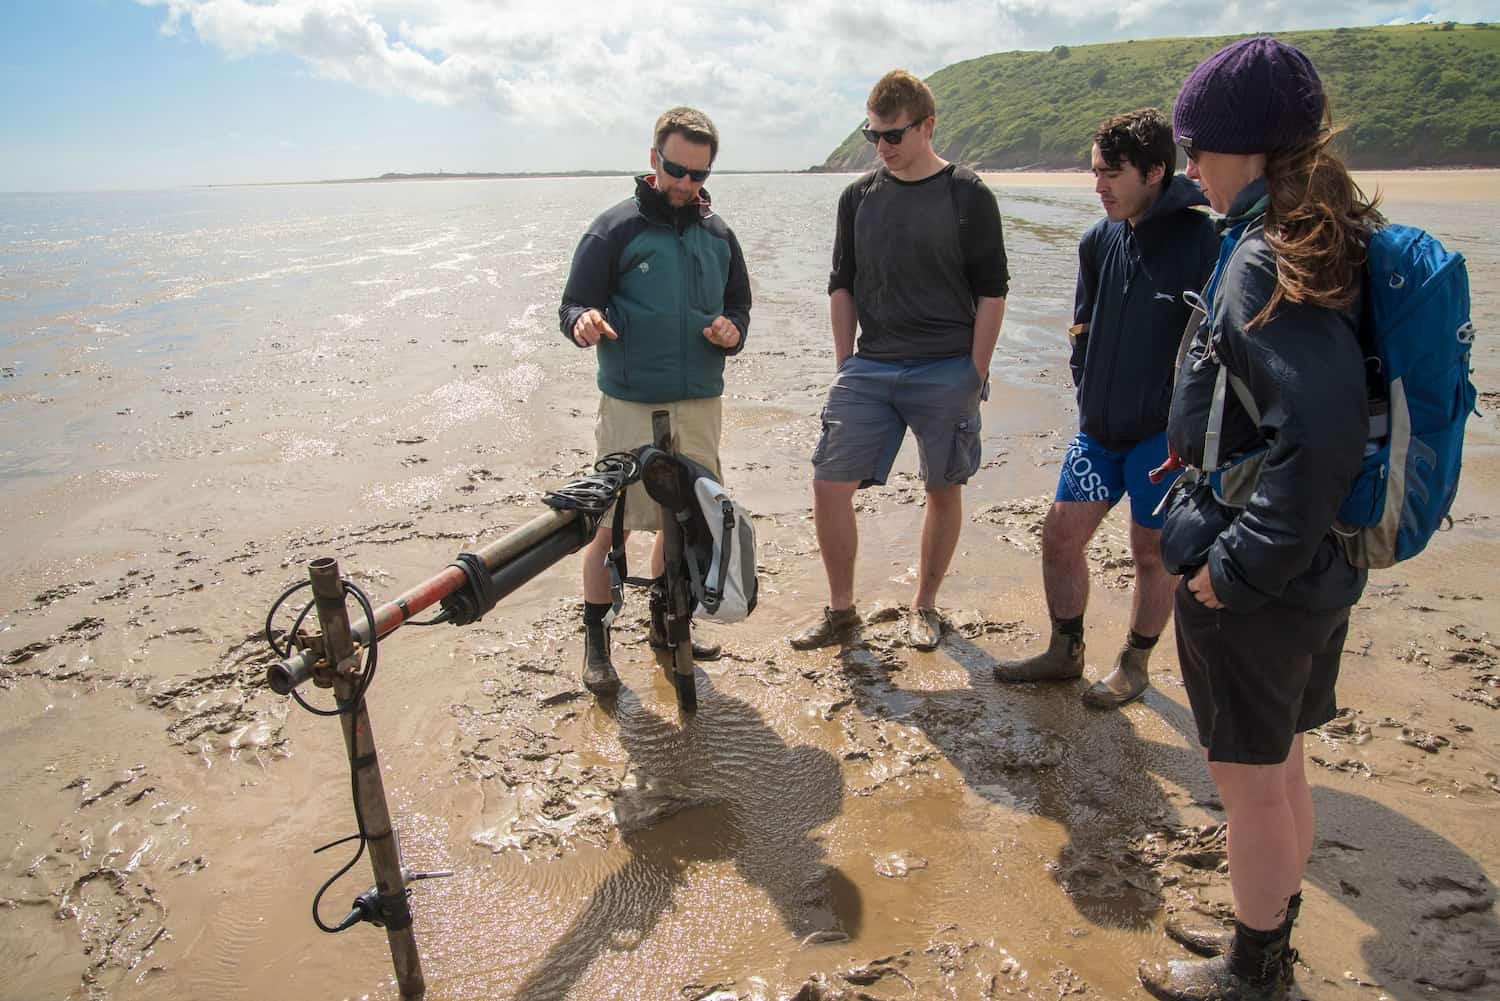
“We are utilizing a Nortek Vector Doppler velocimeter, together with an externally mounted optical backscatter sensor (OBS) and a pressure transducer (PT) to illustrate the temporal patterns of sediment flux to the students,” says Dr Martin Austin, lecturer in coastal sediment dynamics at Bangor University.
Taking advantage of self-contained nature of the Vector
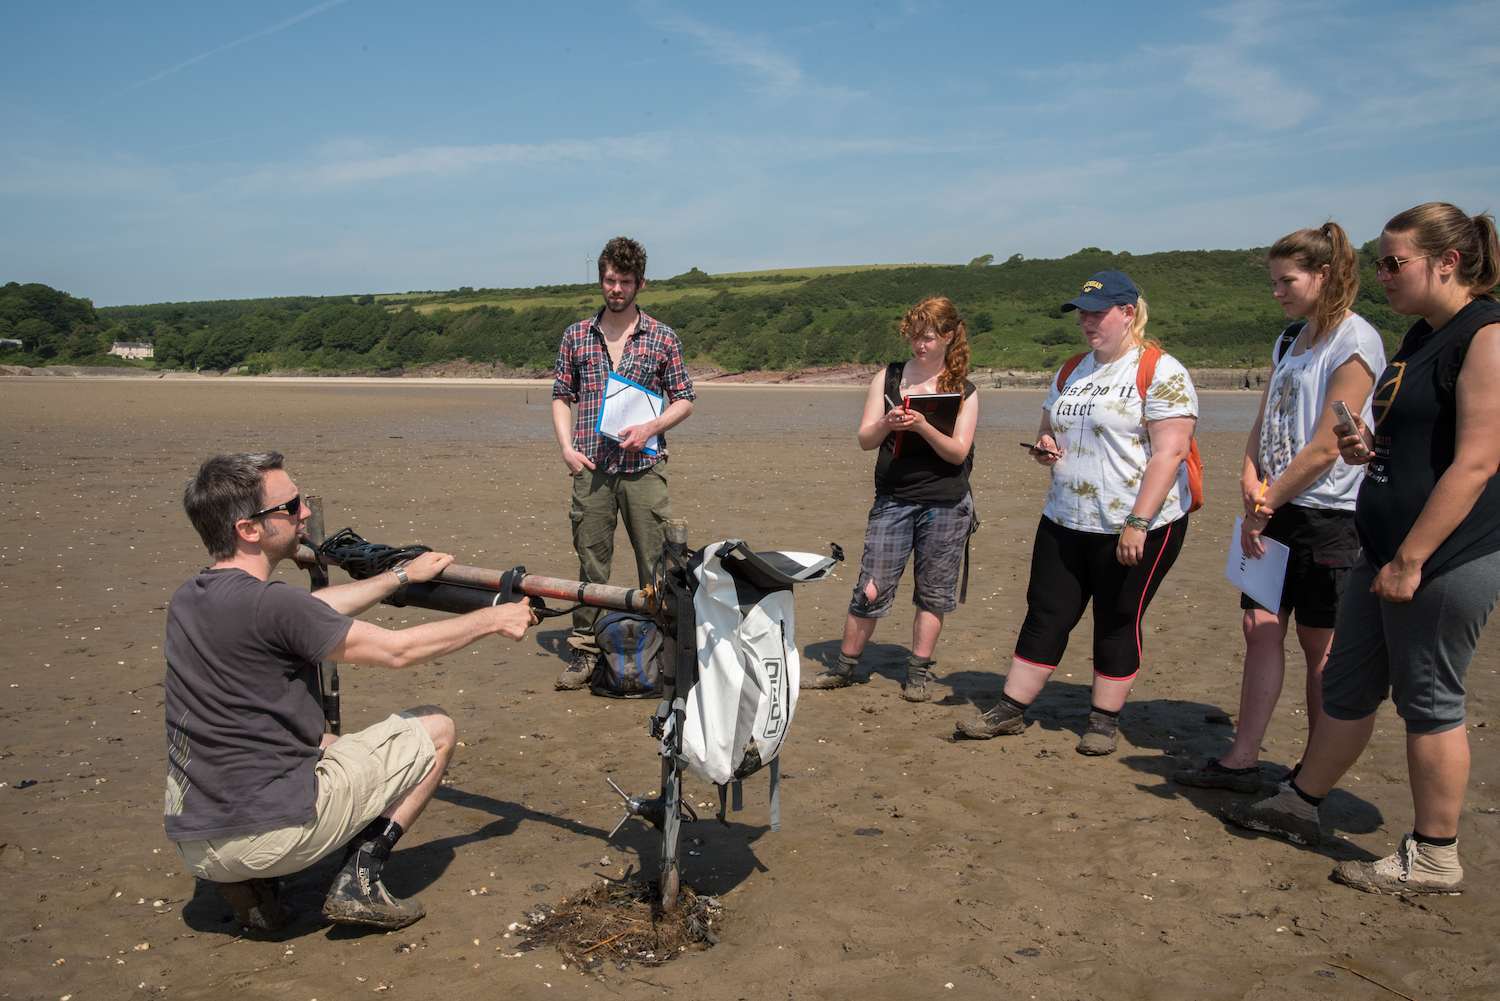
Bangor University’s study group deploys the Vector at the start of the trip and sets it to operate in burst mode, recording 10 minutes of data at 4 Hz every 15 minutes. With its extended battery capacity and large on-board memory, the Vector can easily operate in this mode for the 10-day duration of the field trip.
“The self-contained nature of the Vector and its ability to log external analogue sensors means that it is perfect for this task,” Dr Austin adds.
Click here to discover Nortek’s range of cutting-edge ADCPs.
To enable the students to compute the near-bed suspended sediment flux, Bangor University’s team position the sensor head of the Vector together with an optical backscatter sensor around 20 cm above the bed, while a pressure transducer flush positioned on the bed records even in the very shallowest water depths. All the data are logged internally by the Vector during its burst operations.
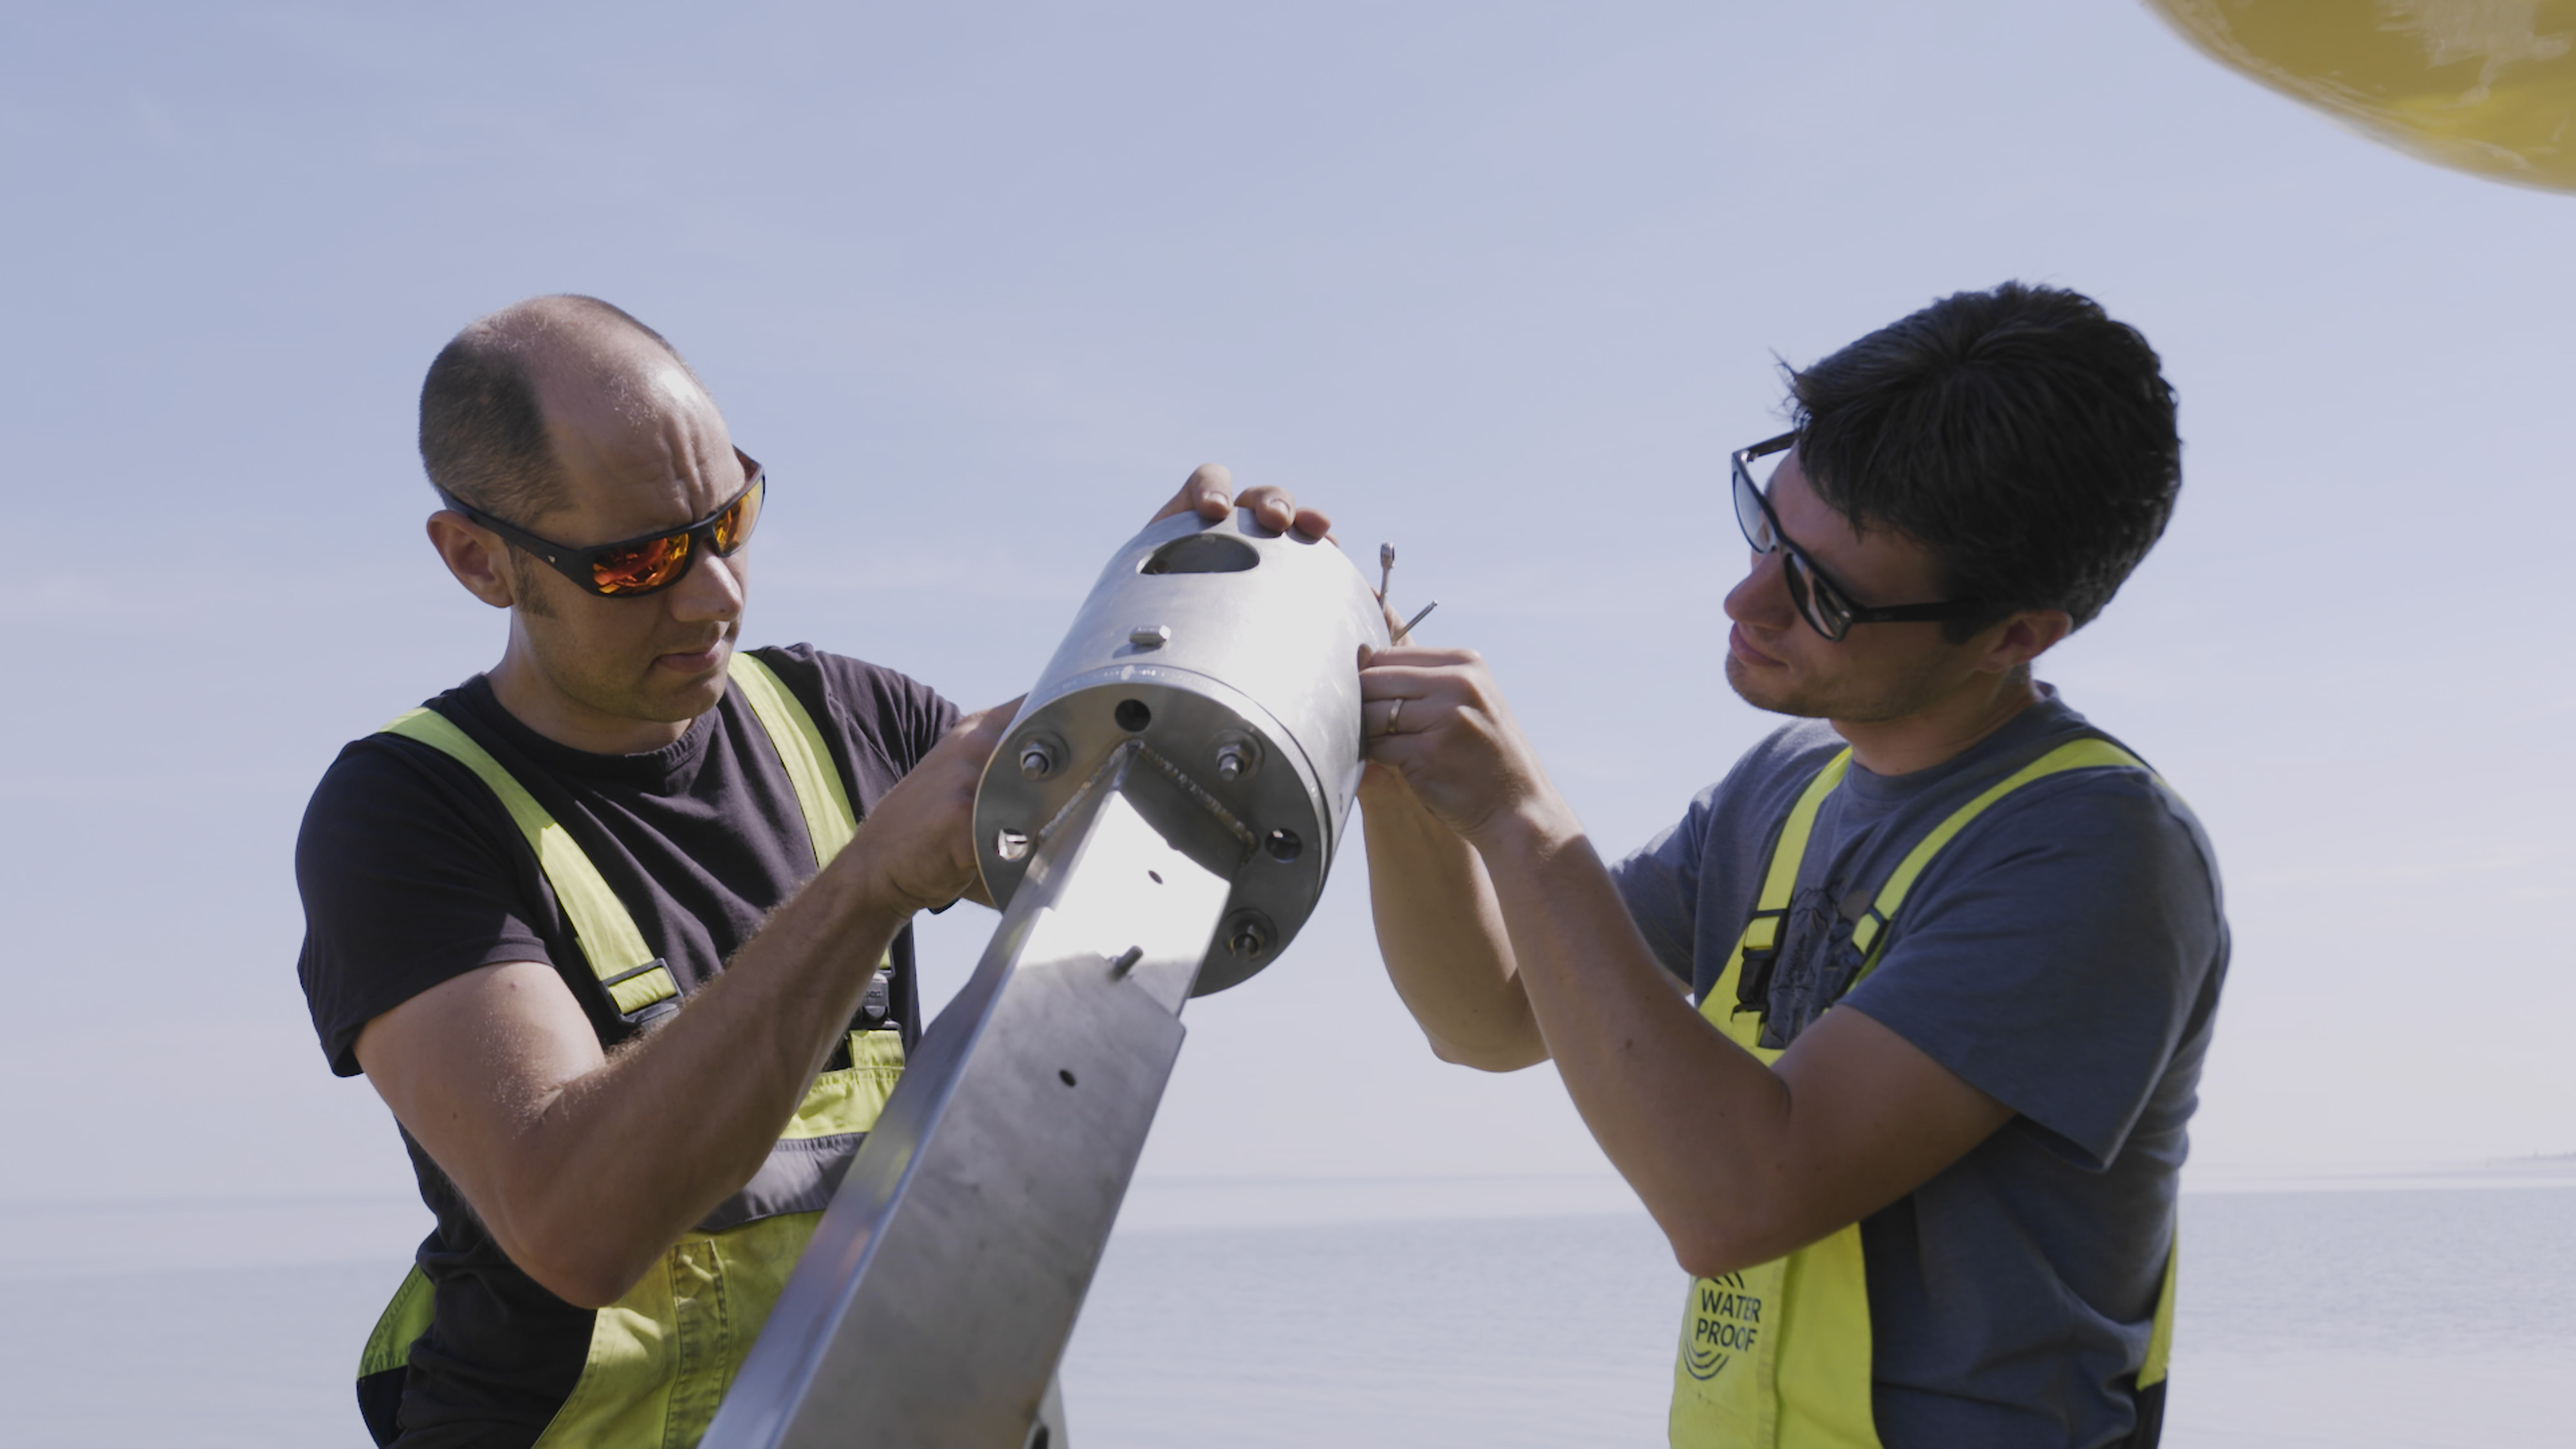
“Each day, a small group of students service the Vector, checking sensor alignments, clearing any weed deposits and downloading ‘their’ data from the previous 24-hour period, whilst at the same time learning about the Doppler principles and valuable skills, such as how to deploy instruments in the field,” Dr Austin explains.
Back in the laboratory, students write MATLAB code to analyze their data and compute the suspended sediment flux during the field course.
Increased scientific understanding of sediment transport
What is the benefit of combining hands-on field learning and academic studies in this way? Dr Austin feels that having utilized the latest Doppler instruments from Nortek during their field studies, Ocean Science students at Bangor are finishing their degrees with an increased scientific understanding of sediment transport processes.
“The students acquire important skills to undertake field deployments and conduct analysis of numerical datasets, thereby giving themselves a great advantage when moving into employment,” he reports.
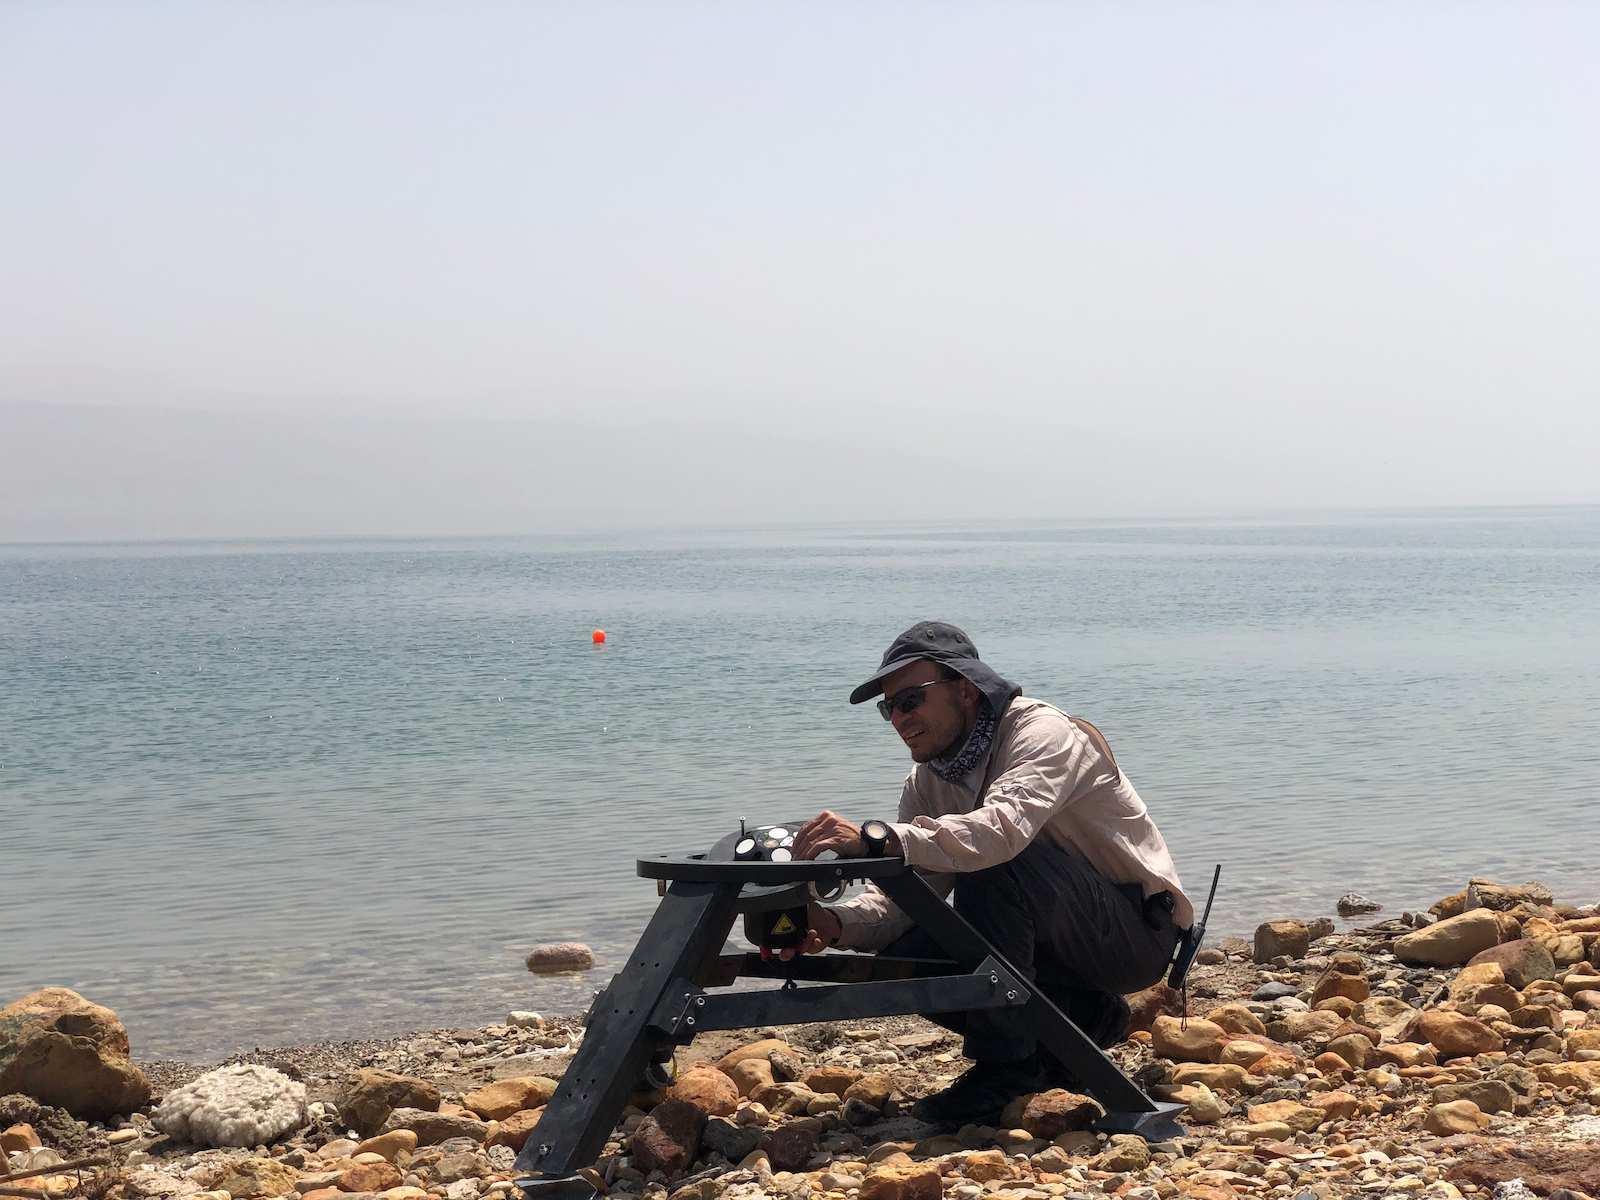
Video: Nortek Vector deployed on an inter-tidal sandbank
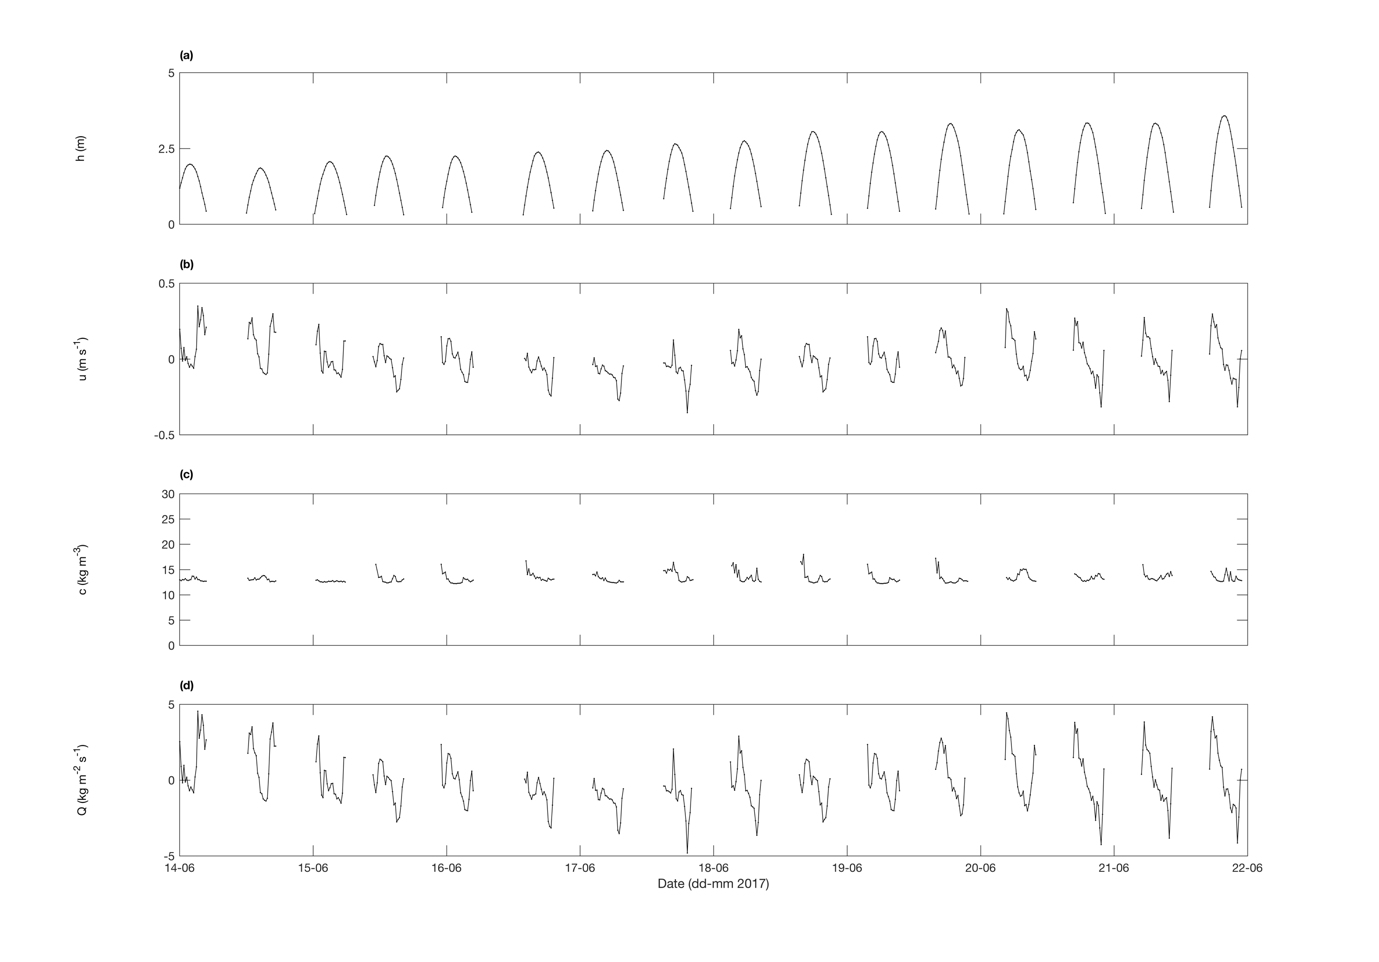
The figure shows the changing water depth, flow velocity and suspended sediment concentration as the semi-diurnal tide floods and ebbs in the estuary; flow velocities are noted to be strongest during the very shallow water depths at the start of the flood tide and end of the ebb tide. In the lower panel, the suspended sediment flux is shown to be direct up-estuary during the flood tide and seaward during the ebb; the sum of the flux over the entire semi-diurnal tidal cycle (and all of the tidal cycles) determines the net direction of transport.
Read the latest news on Nortek product innovation and exciting features.
Timeseries data recorded by the Vector velocimeter in the figure above pertain to the following parameters: (a) Water depth; (b) stream-wise flow velocity 20 cm above the bed, positive up-estuary; (c) suspended sediment concentration 20 cm above the bed; and (d) suspended sediment flux, positive up-estuary.
