Using ADCPs to unravel the dynamics between sea ice, ocean and climate
- User stories
Synopsis
Challenge
Sea ice in the Arctic has major impacts on the global climate, but due to the harsh and remote nature of the Arctic, little is known about the dynamics between sea ice, the ocean and the surrounding weather.
Solution
Using multiple Signature series ADCPs to track sea ice's growth and retreat, as well as measure currents and waves in the area, the team gathered a full year's worth of data to investigate these processes and interactions.
Benefit
From a single instrument, the team was able to capture a full picture of their measurement area in the Arctic, where data like this is sparse and much needed to understand the global climate.
Climate change is impacting every corner of our planet. While remote from heavily populated areas, the Arctic is one of the fastest-warming regions.
“In the summer, the Arctic has always had a retreat of sea ice. But that retreat is now just massive in terms of the areal extent, the thickness of the ice, and the quality of the ice,” says Professor Jim Thomson, Senior Principal Oceanographer at the University of Washington’s Applied Physics Lab and a Professor in the Department of Civil & Environmental Engineering.
Using an ADCP for sea ice research, unlocking interactions with wind, turbulence, and warming
What happens in the Arctic doesn’t necessarily stay in the Arctic.
“It’s pretty conclusive now that what’s happening in the Arctic is affecting global weather patterns,” Thomson says, highlighting how New York has been experiencing some frigid winters as a result of changes to the jet stream, mediated by warming in the Arctic. For climate modeling, “it’s becoming obvious that we have to get the Arctic right to get the global climate right, and it’s really about knowing what the ice is doing,” says Thomson.
With the help of the Signature500 acoustic Doppler current profilers (ADCPs), Thomson and colleagues have been unlocking some of the secrets of the ice, including its complex interactions with wind, turbulence and warming.
“We can think of the ocean being built up in all these layers, and the structure of those layers is based on how salty and how warm the water is etc. In most of the world, the warmest water sits near the surface, but in the Arctic, salinity is a more important driver, so cold water ends up on the surface instead,” says Sam Brenner, a PhD student with Professor Thomson and Affiliate Associate Professor Luc Rainville, also with the University of Washington’s Applied Physics Lab.
Measuring the effect of loss of sea ice and turbulent mixing of warm and cold water
Beneath this cold-water layer lies warmer waters, but there is little mixing between these two layers, partly thanks to sea ice.
“The ice acts as a lid, insulating the ocean from the wind, but as the ice breaks up, the wind can push on the ocean more, and all of that momentum from the wind can make its way into the ocean, causing turbulent mixing of this warm water that’s underneath the cold layer,” Brenner explains.
“As that water gets warmer, and as the ice loss advances, we have this potential for a feedback mechanism where you’re mixing more of that warm water up to the surface, and that melts more of the ice.”
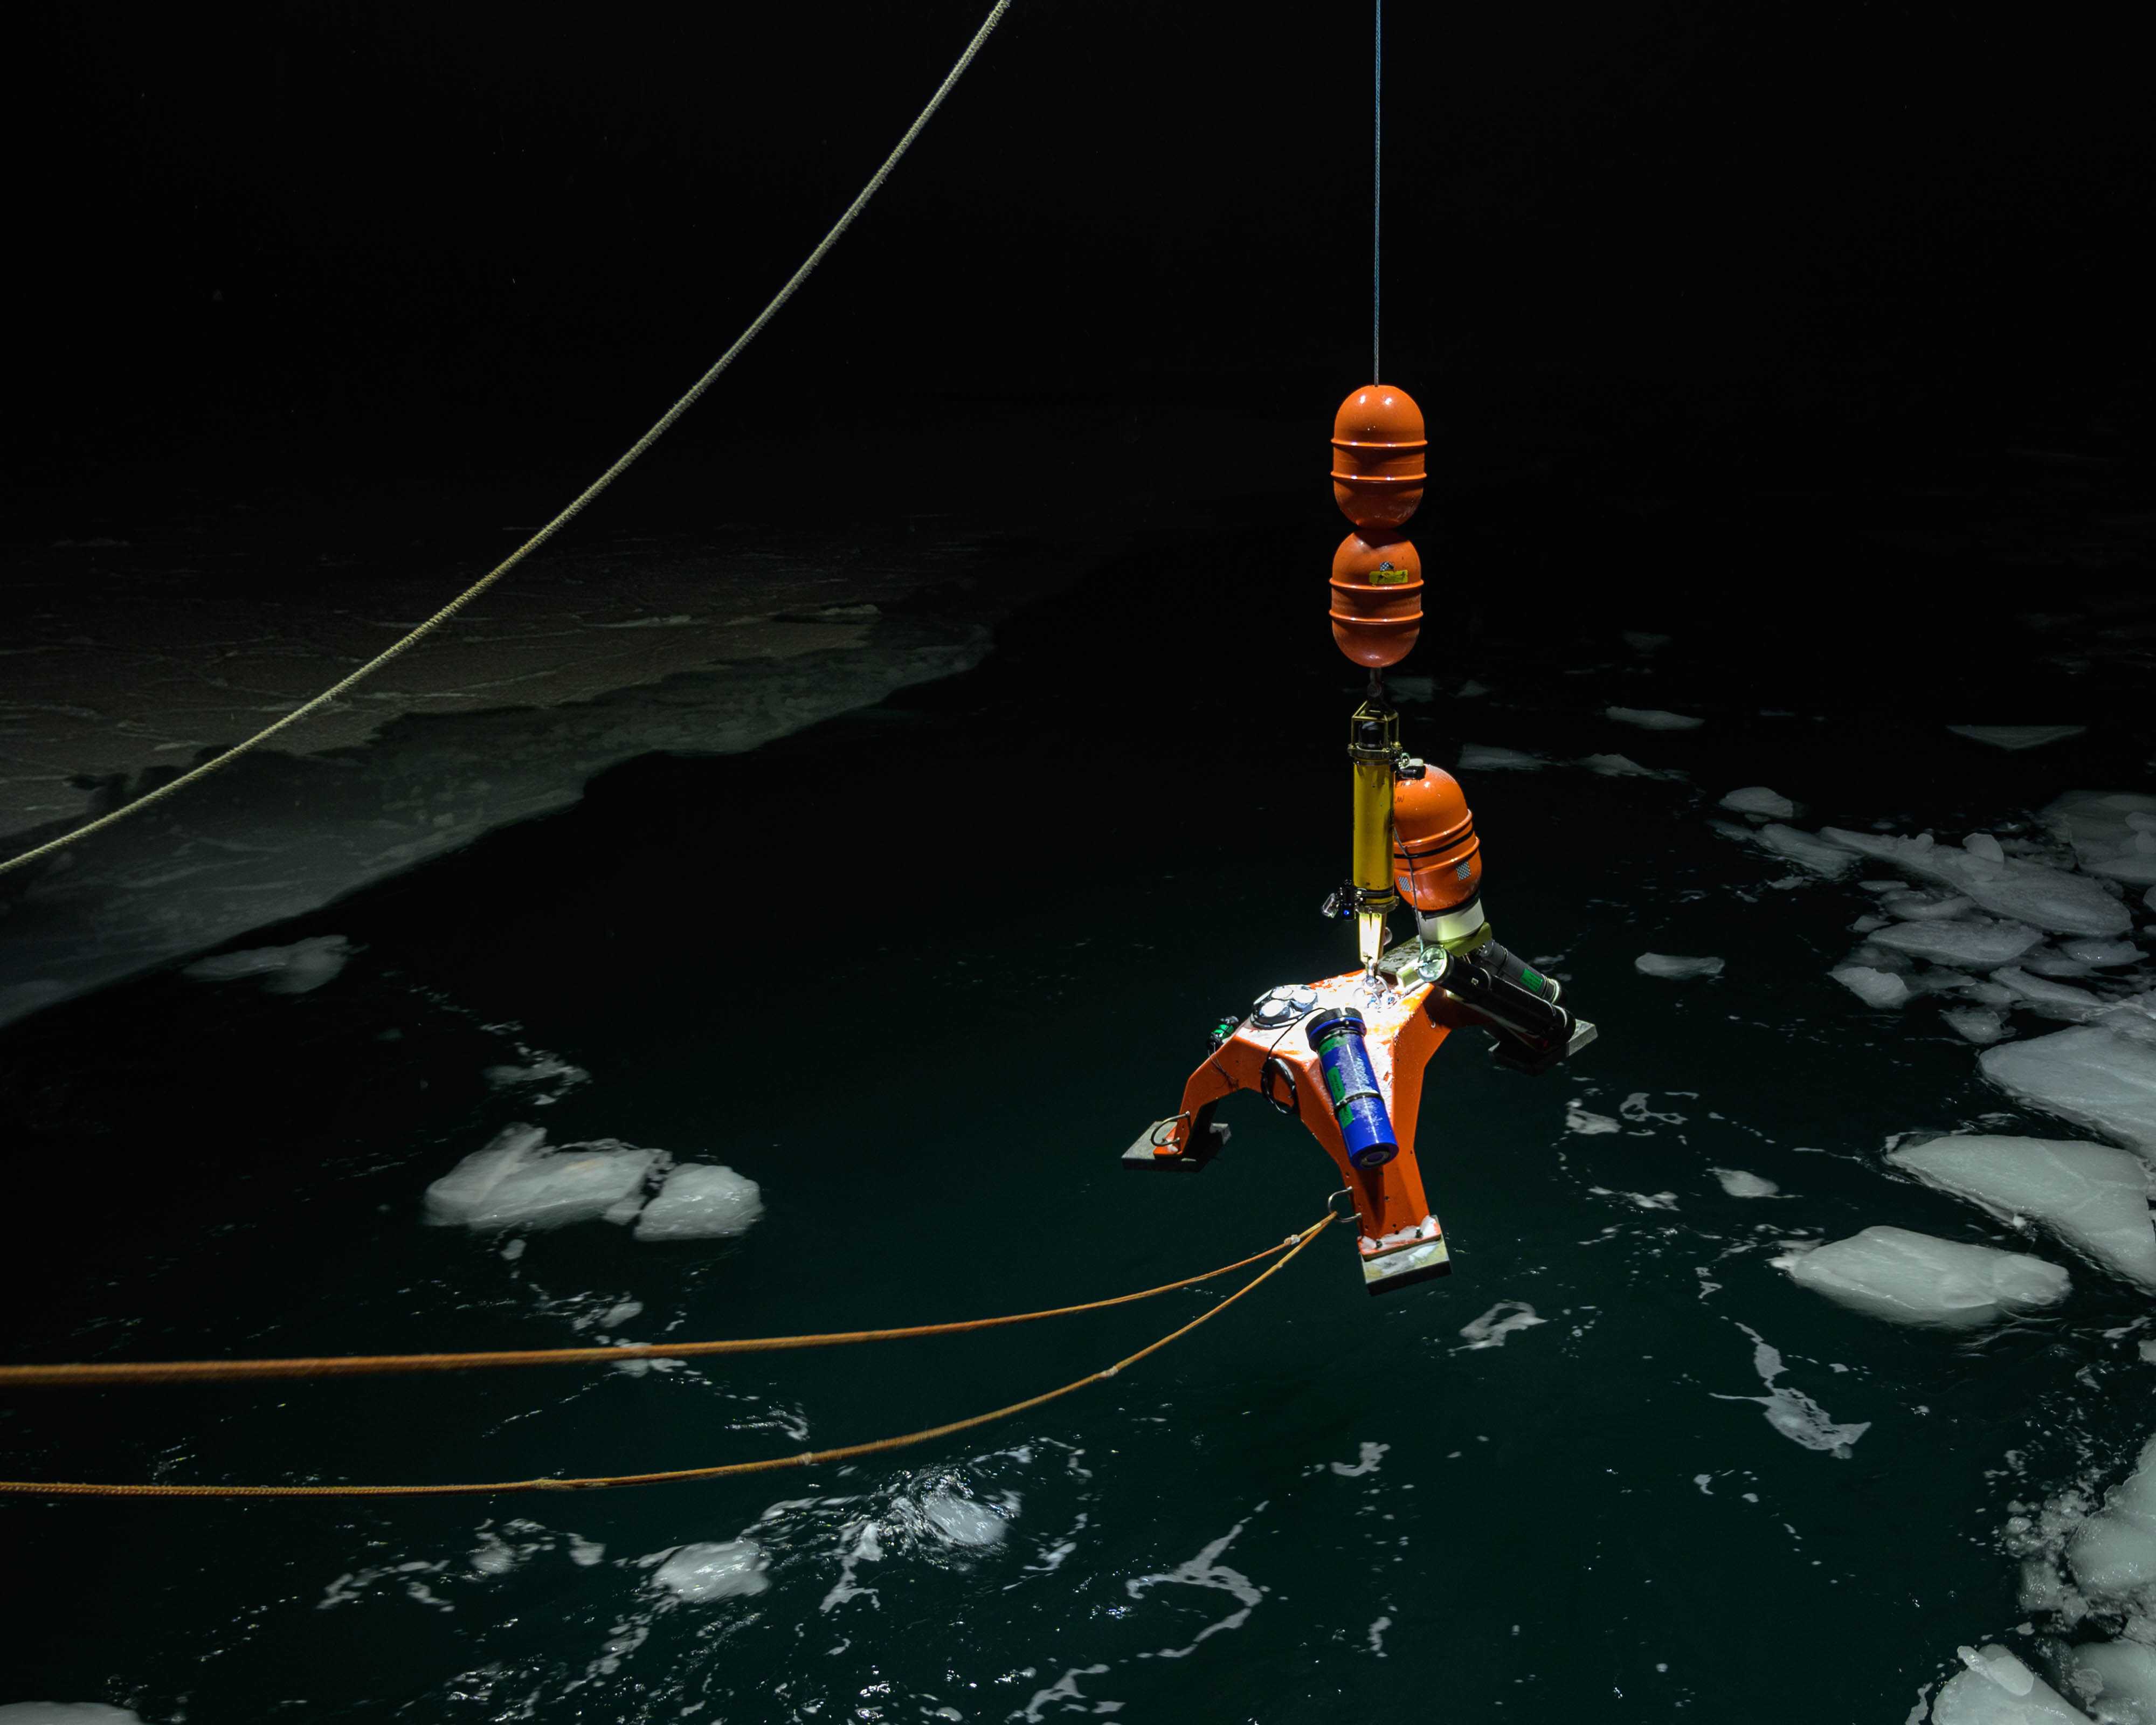
An ADCP capable of measuring the ice’s “geometry” as well as velocity and direction
Sea ice moves with wind and currents, pushing it in and out of warm-water patches. While the ice’s size plays a role in its movement, so too does the ice’s geometry – its rugosity – beneath the sea surface. In essence, rugosity can influence the friction between the ice and water, which in turn influences its movement, how it grows and how it melts. Using the Signature500 ADCP, Brenner hasn’t just been able to “map” the ice’s geometry, but also the velocity and direction the ice is moving – in remarkable detail.
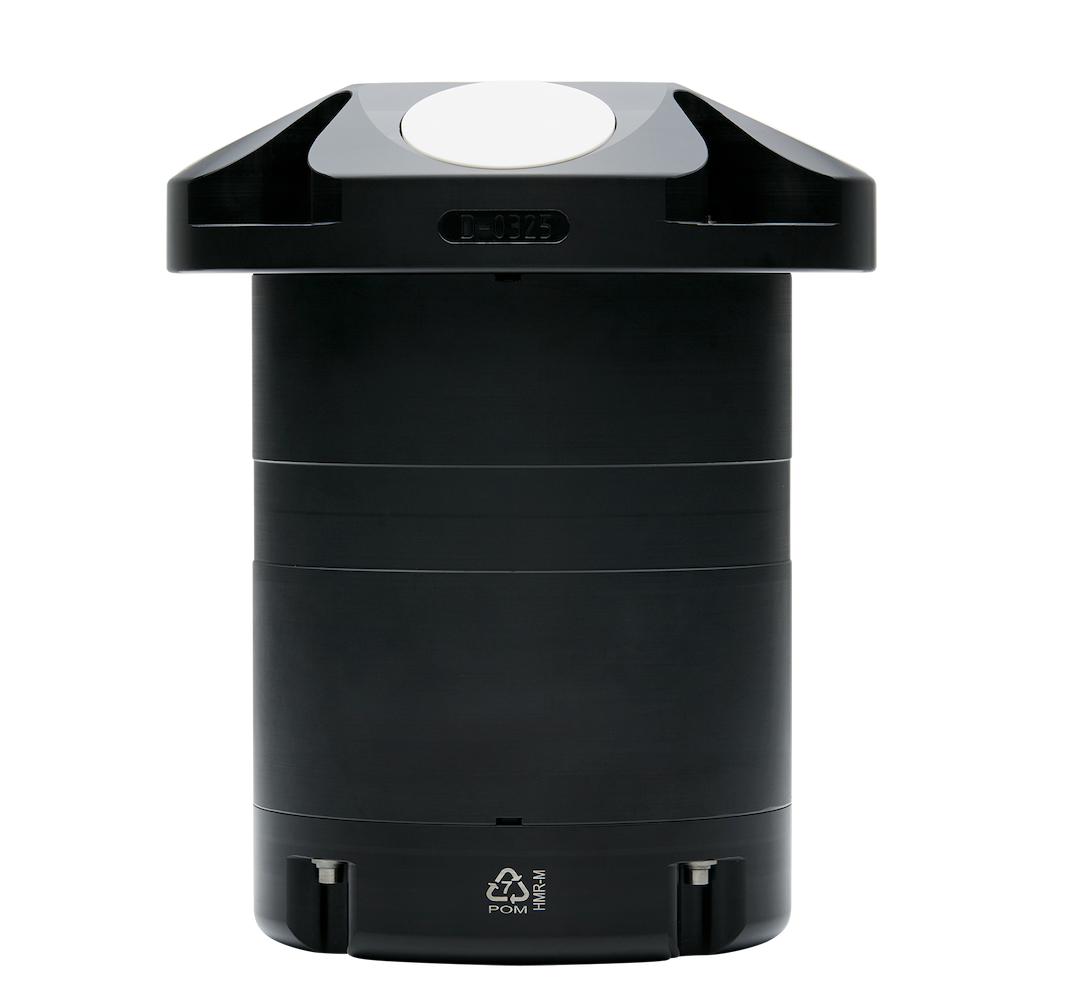
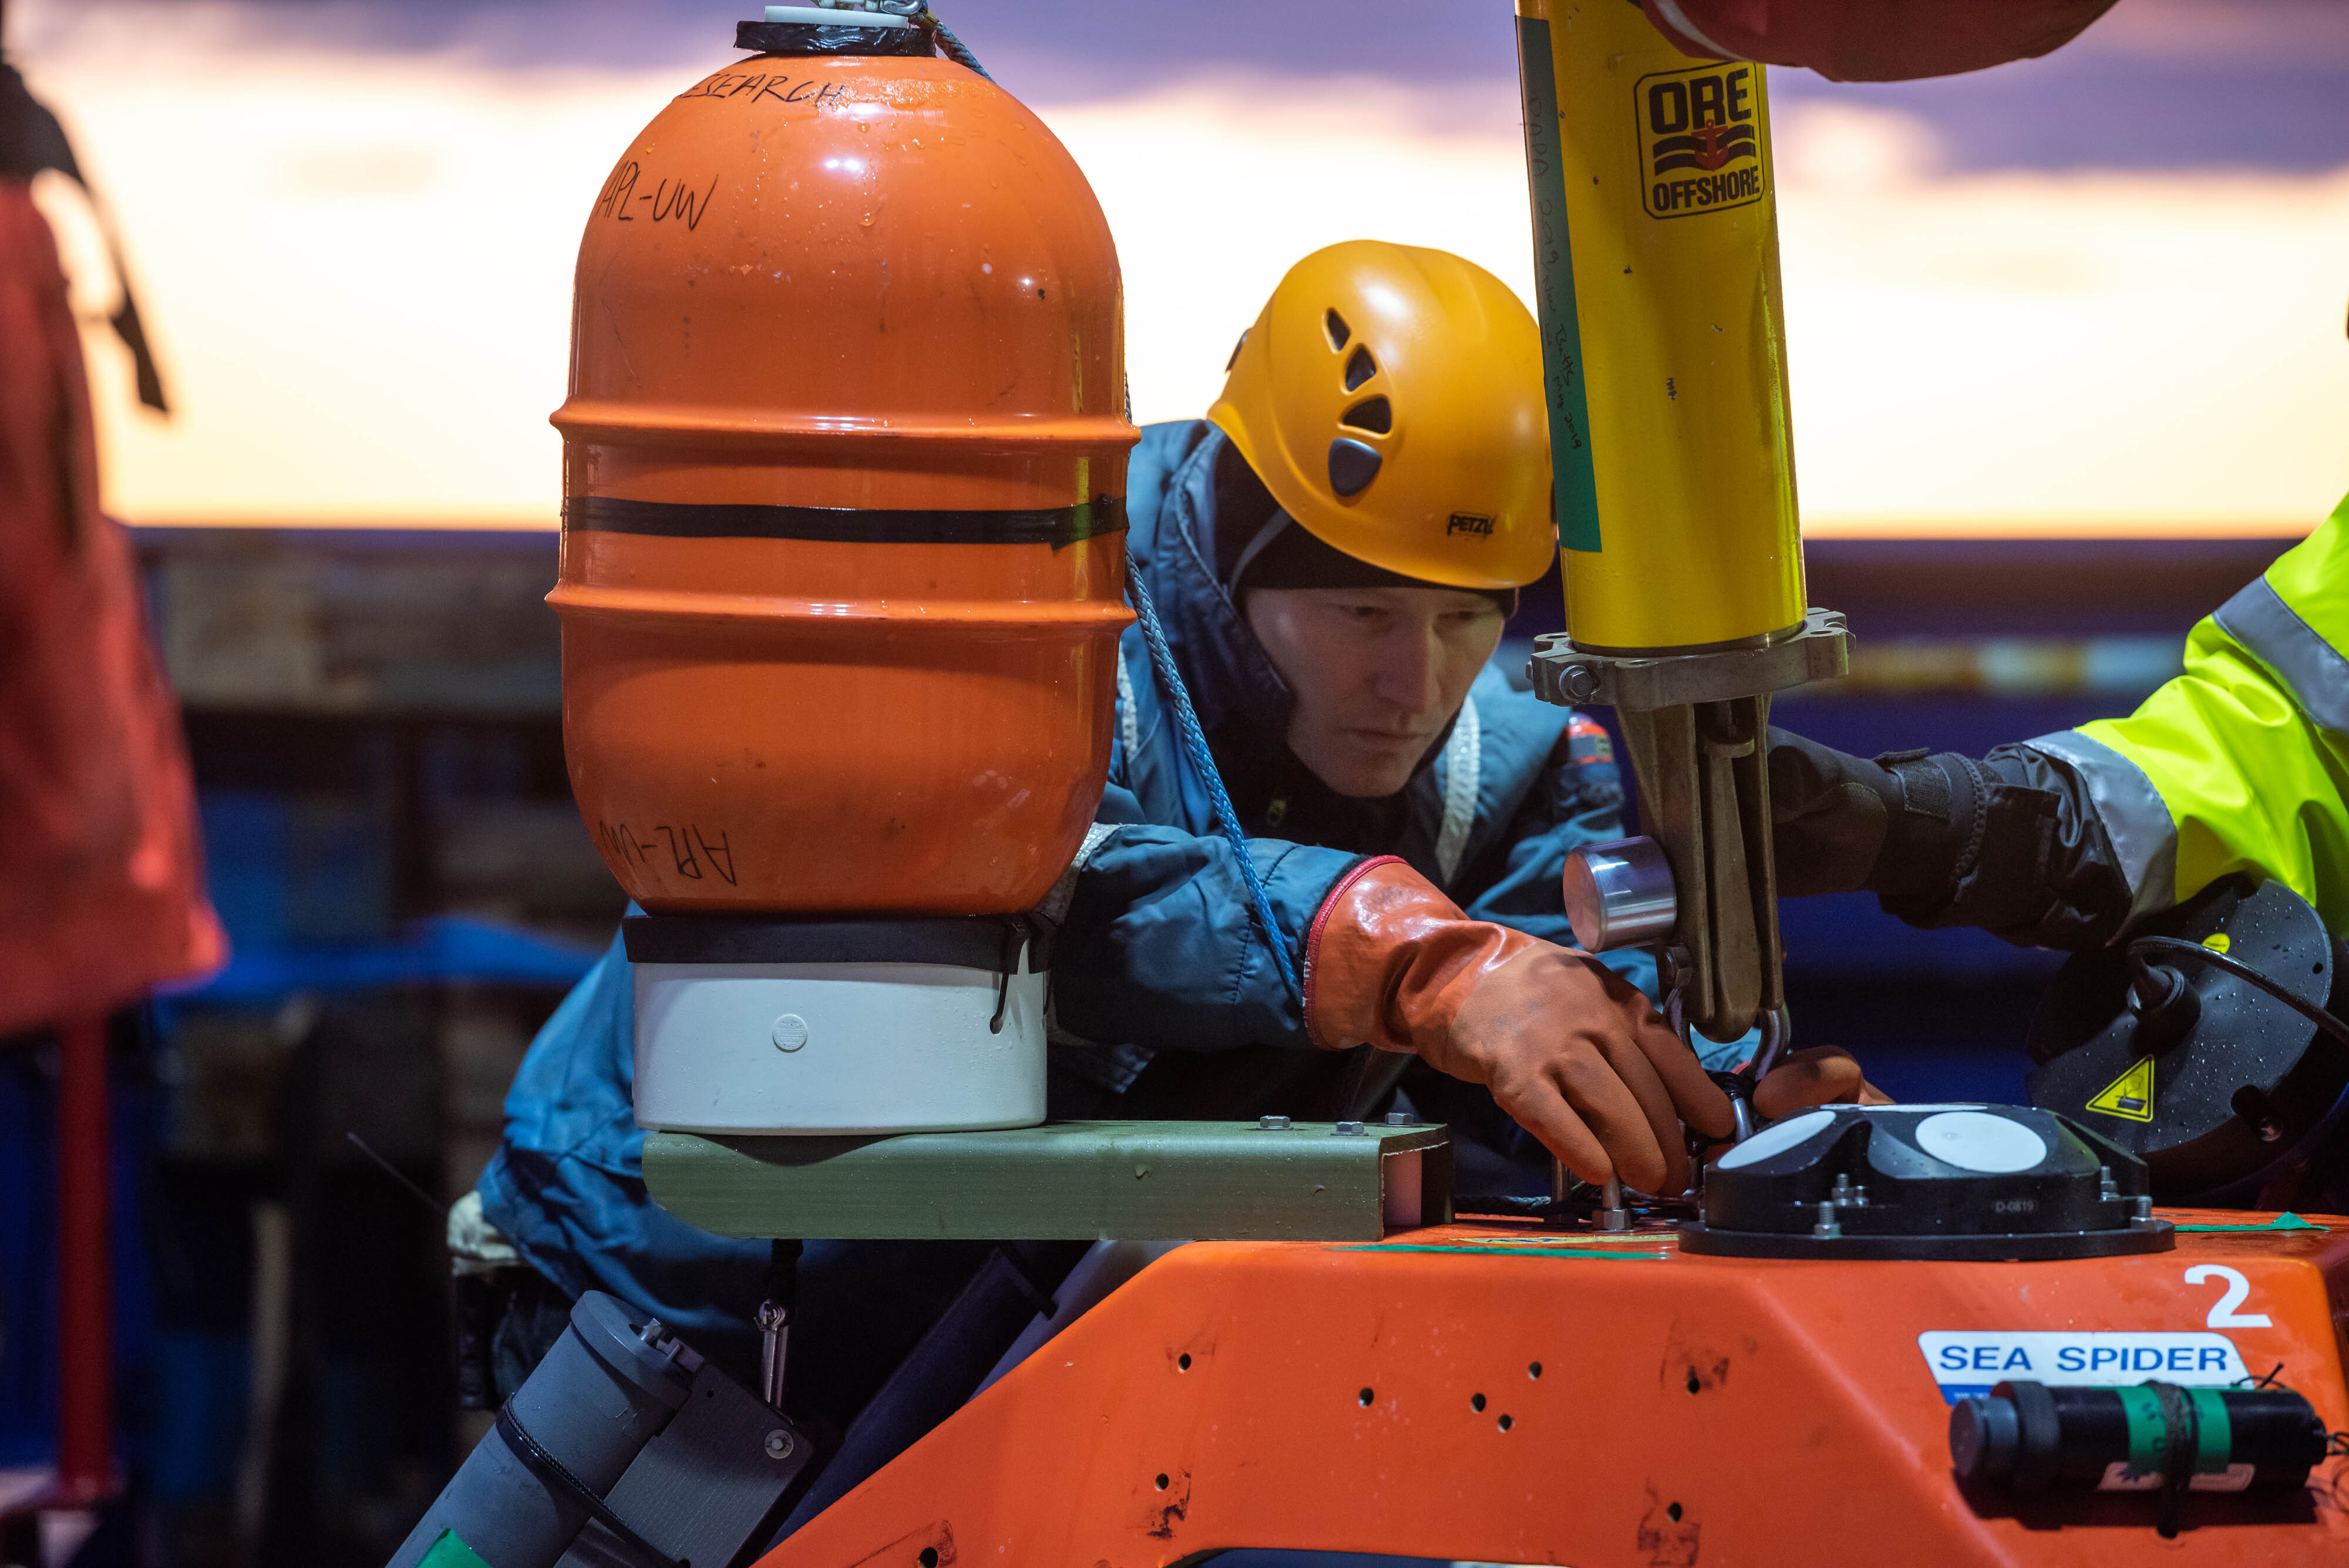
The Signature500 ADCP is three instruments in one – measuring ice, waves and currents
While acoustic Doppler current profilers are not traditionally used to measure sea ice rugosity and movement, the Signature ADCPs have the ability to do so.
“I have grown to think of the Signature500 as three instruments in one – an ice instrument, a wave instrument and a current instrument. Then there’s also the echosounder, which allows you to do acoustic images,” says Thomson.
The Signature500’s sibling, the Signature250, is also capable of monitoring ice. While the instrument samples at a more extensive range, it operates at a lower frequency and thus provides lower spatial resolution. This makes the Signature250 less suitable for measuring fine-scale processes or spatial scales, such as the peaks or troughs on the underside of sea ice, than the Signature500.
While the Signature1000 can sample at a much higher frequency than the Signature500, its range is much more limited. Although the Signature1000 can technically be used for ice measurements, it should only be used where the ice is highly unlikely to reach the same depths as the instrument.
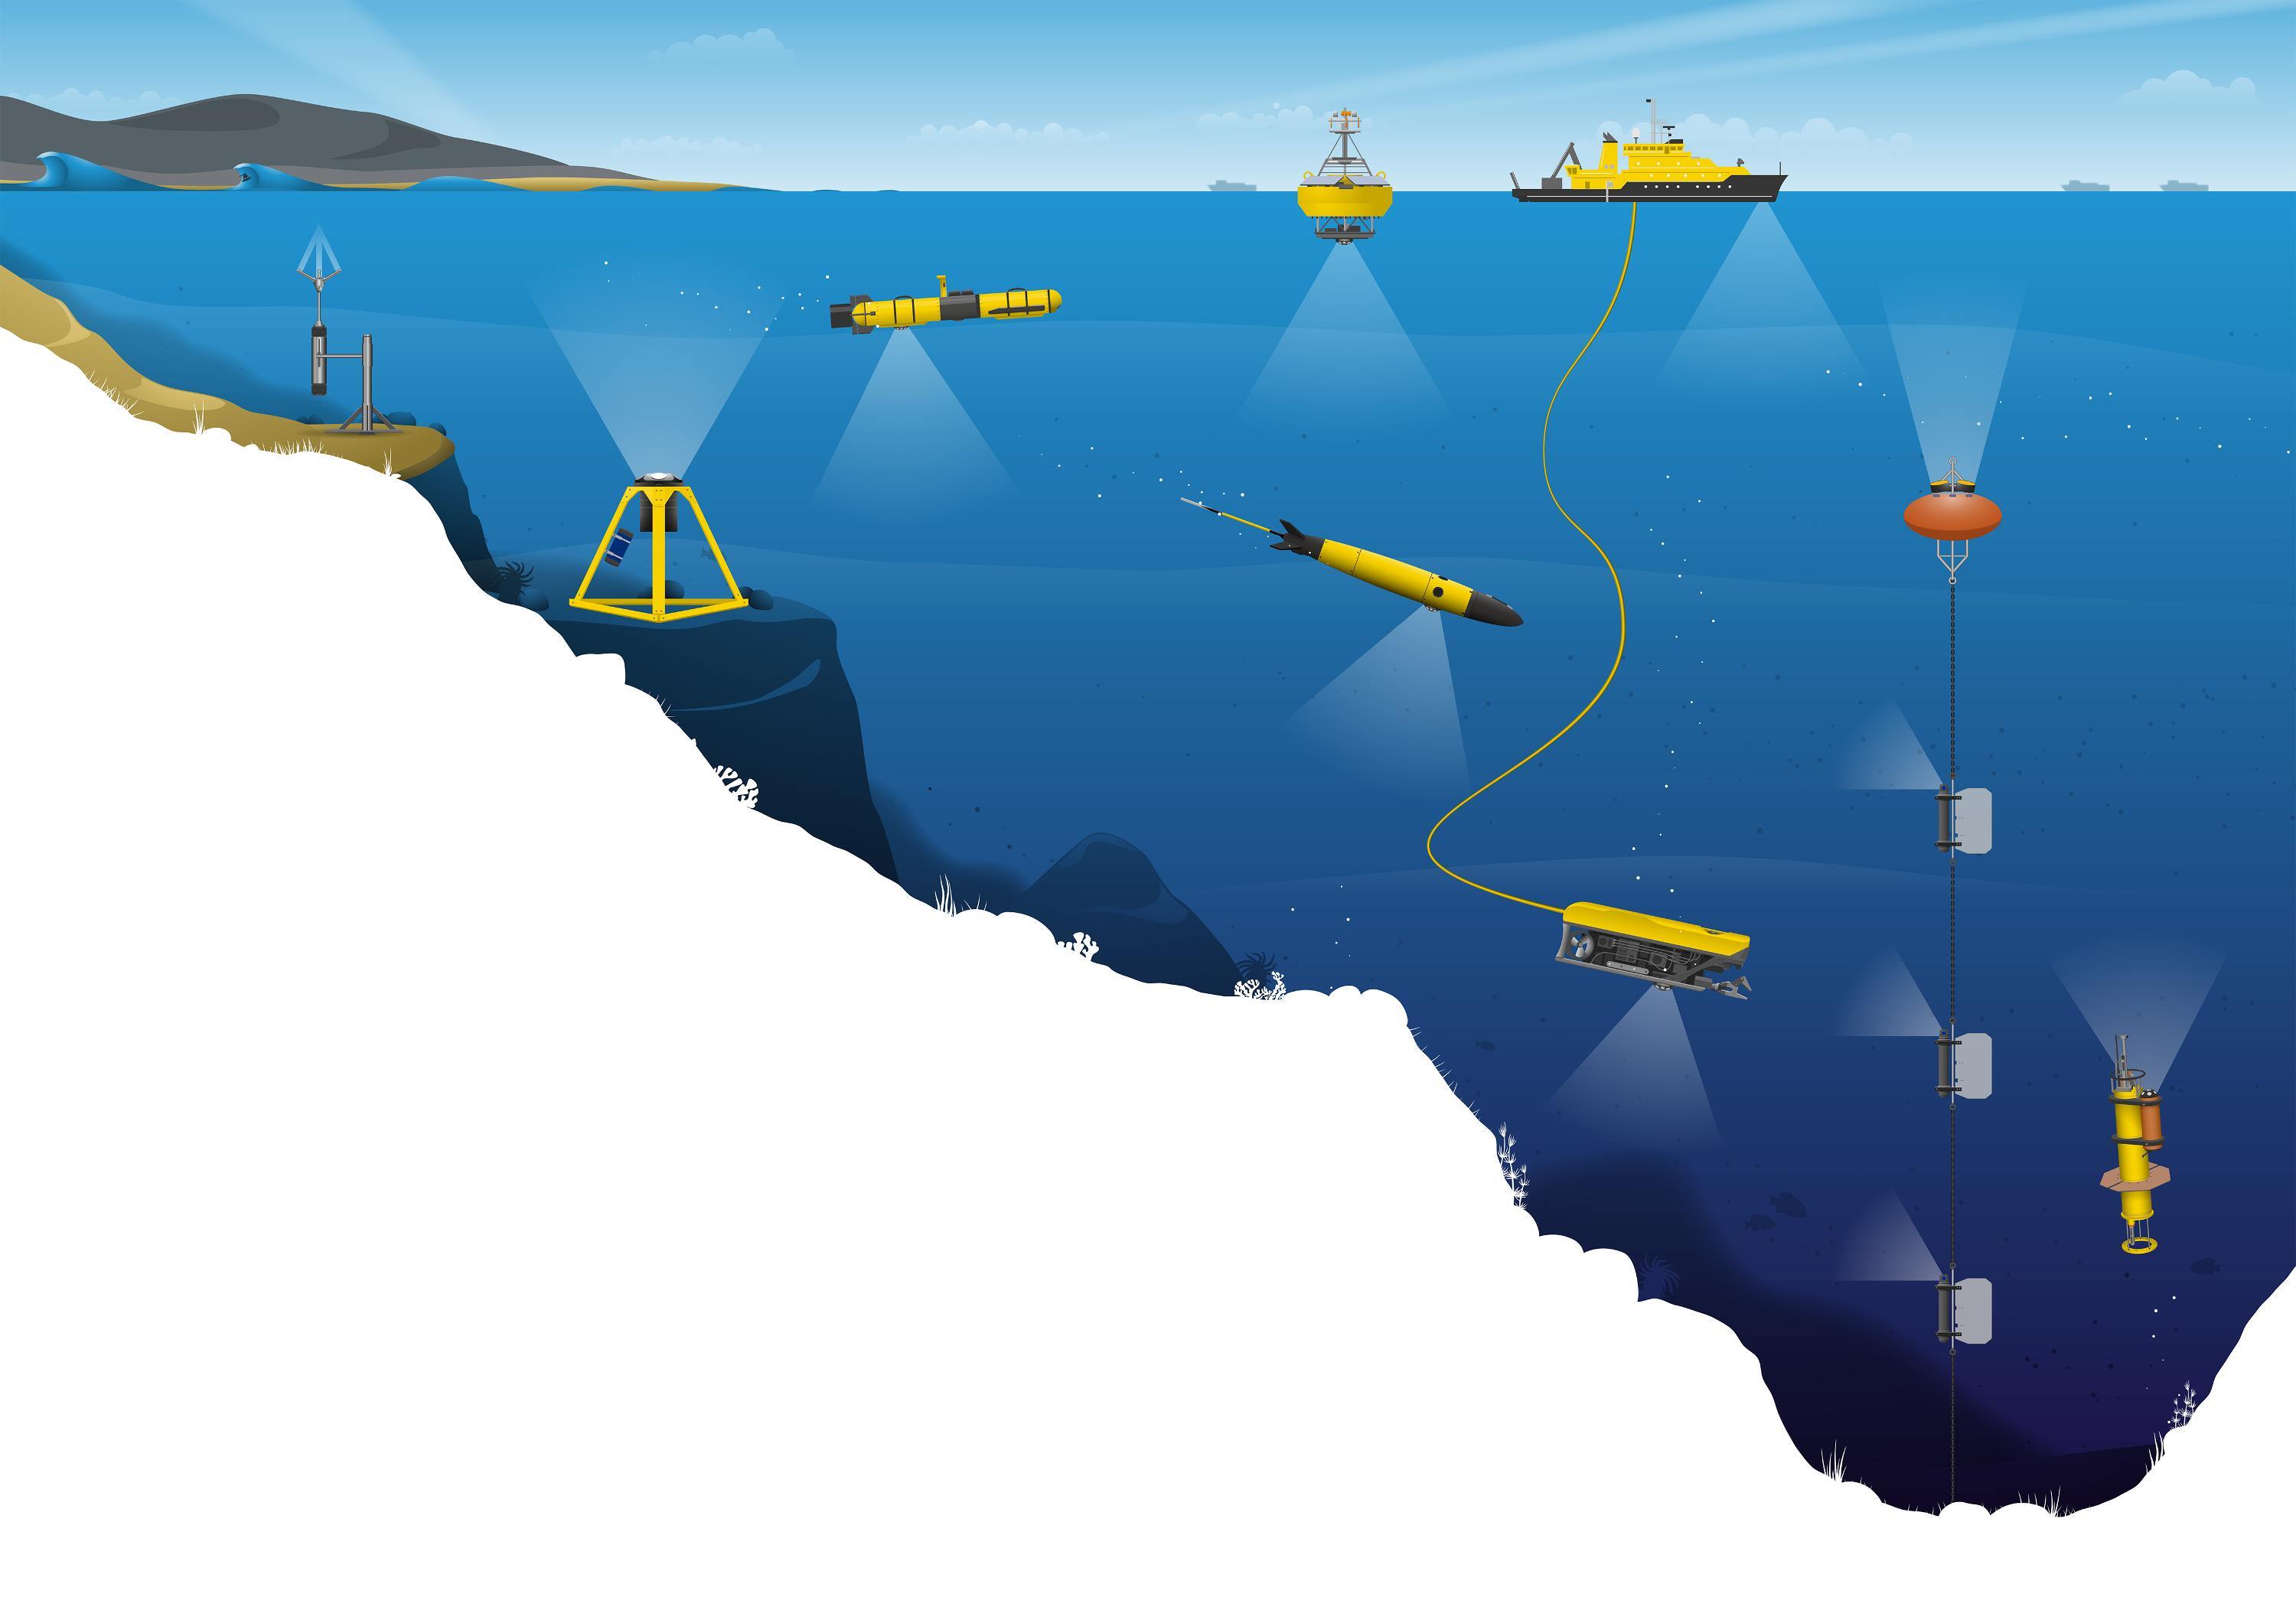
An ADCP for long-term velocity, current and altimeter measurements
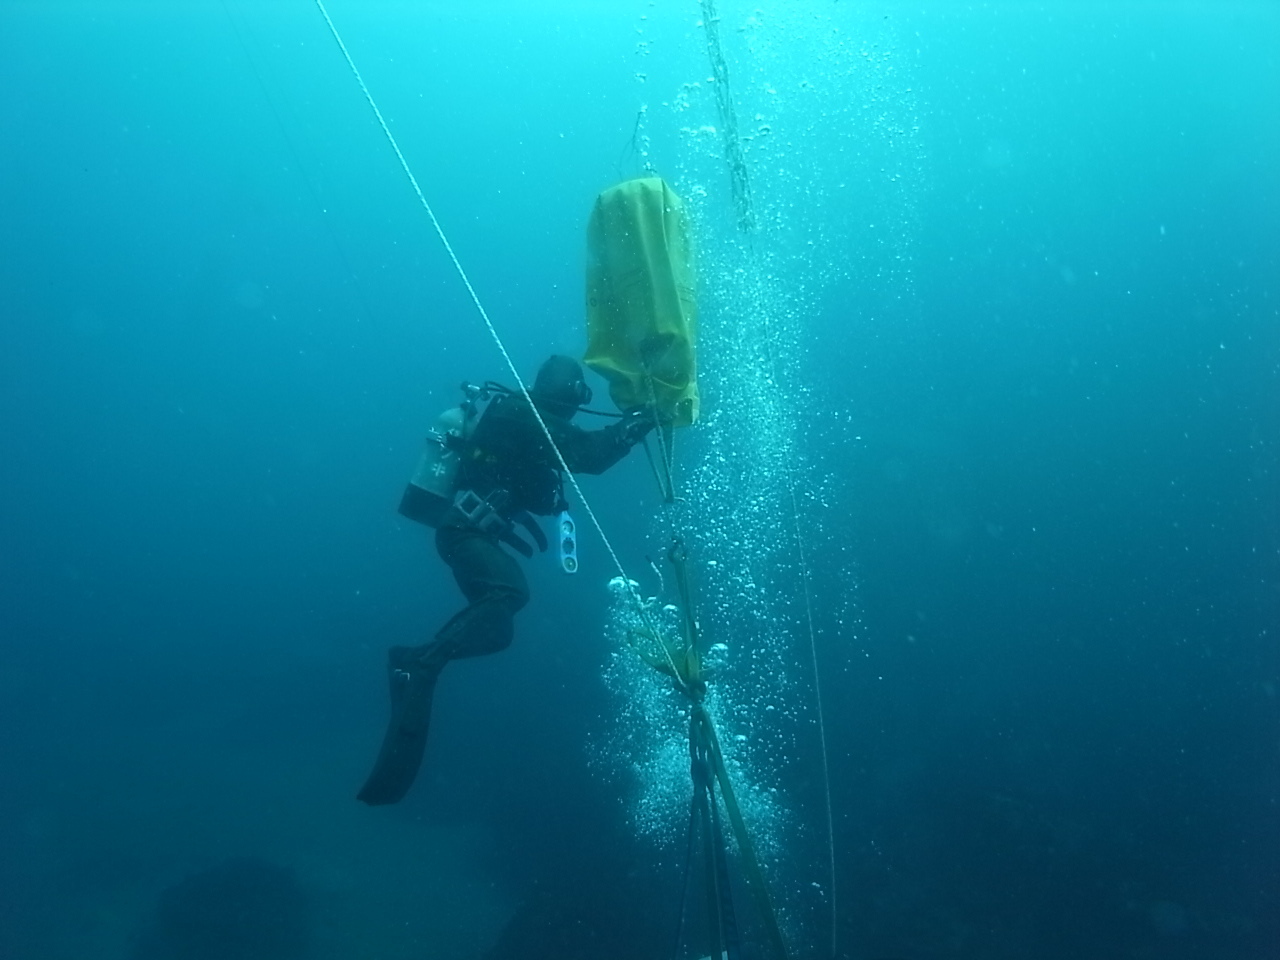
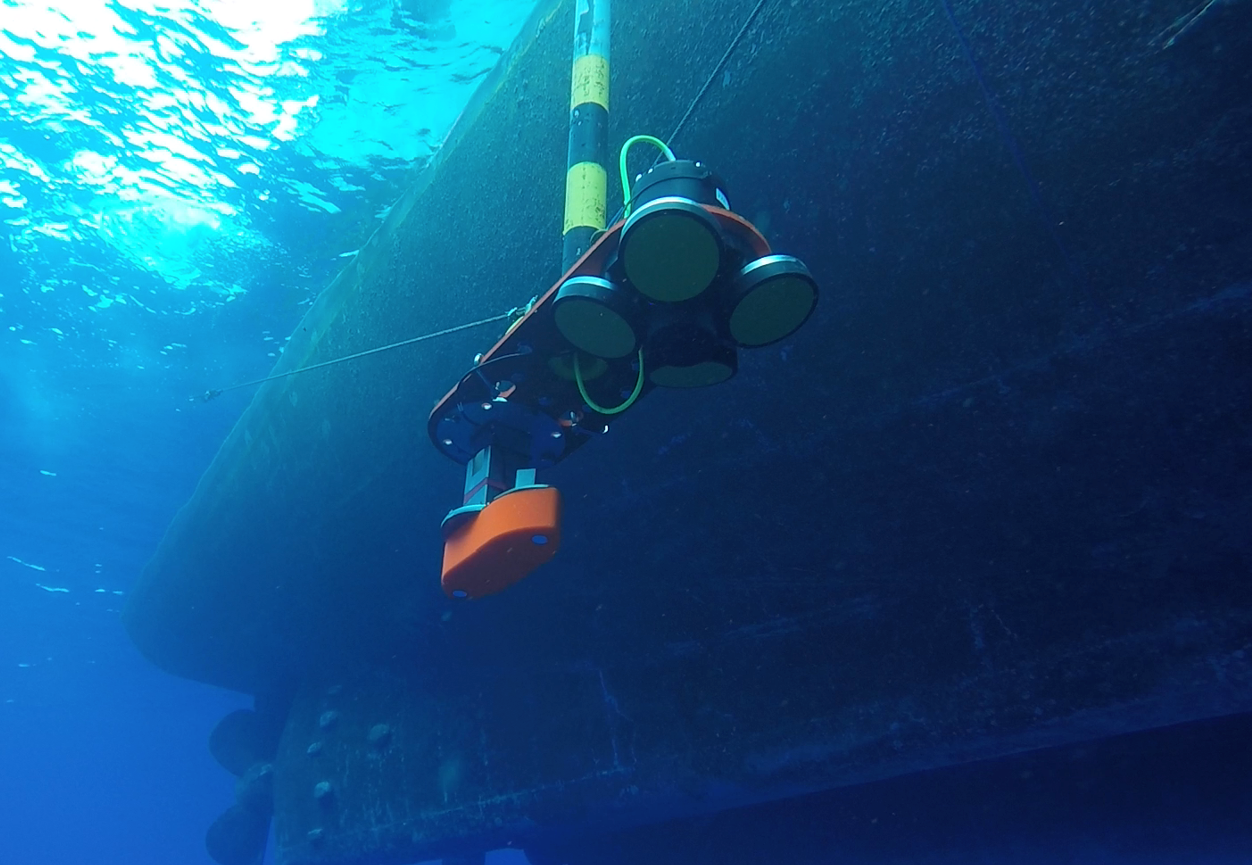
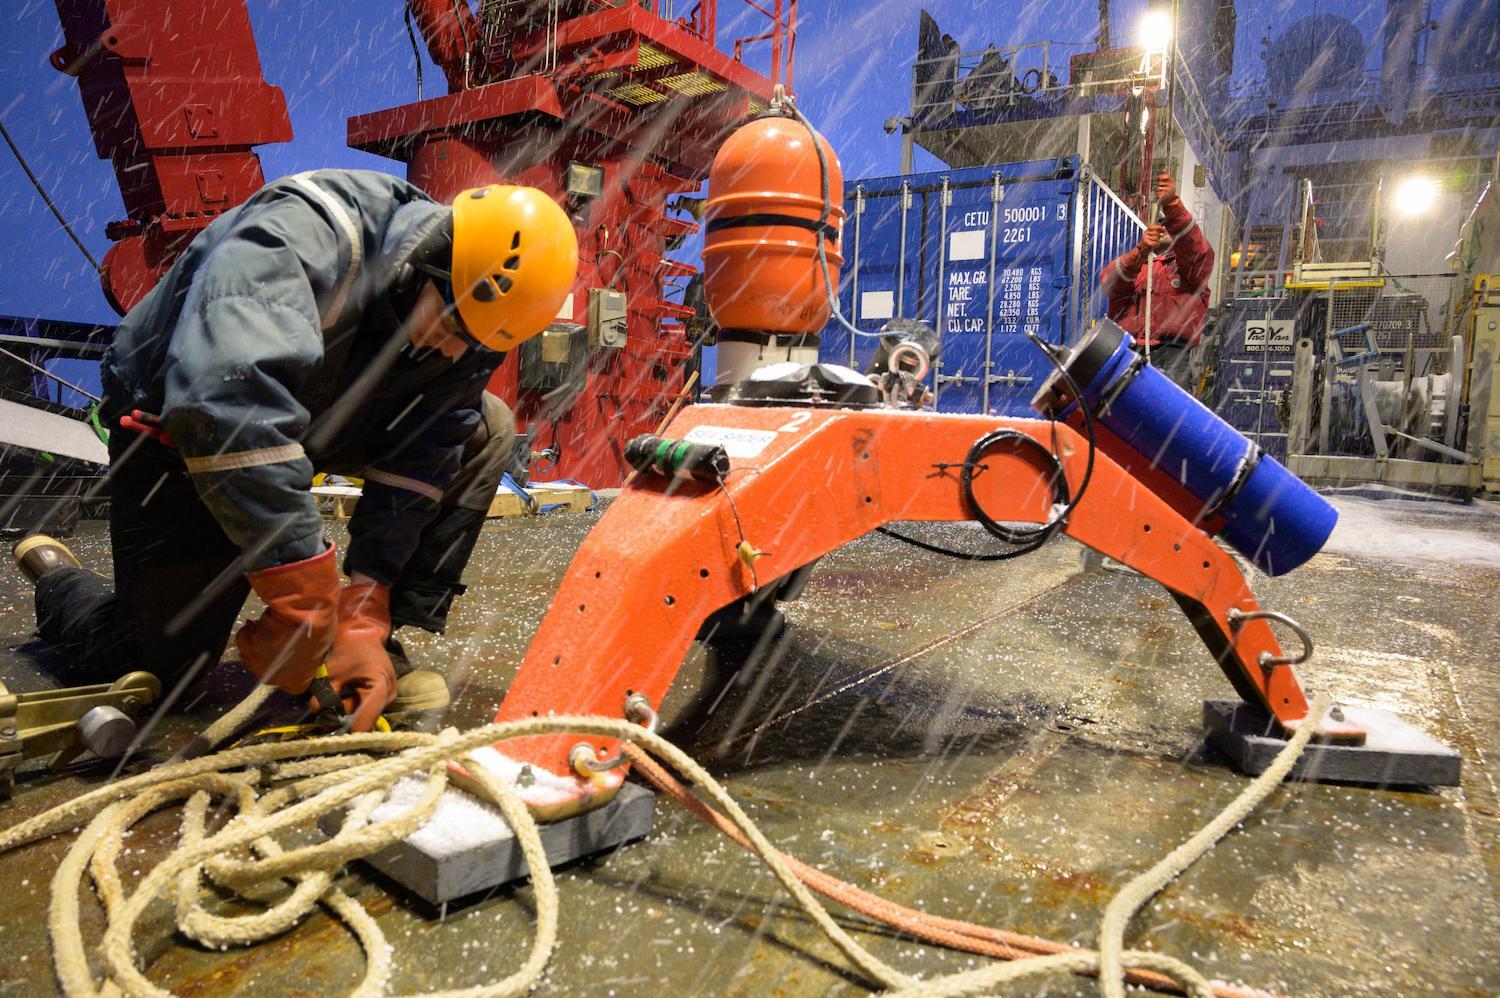
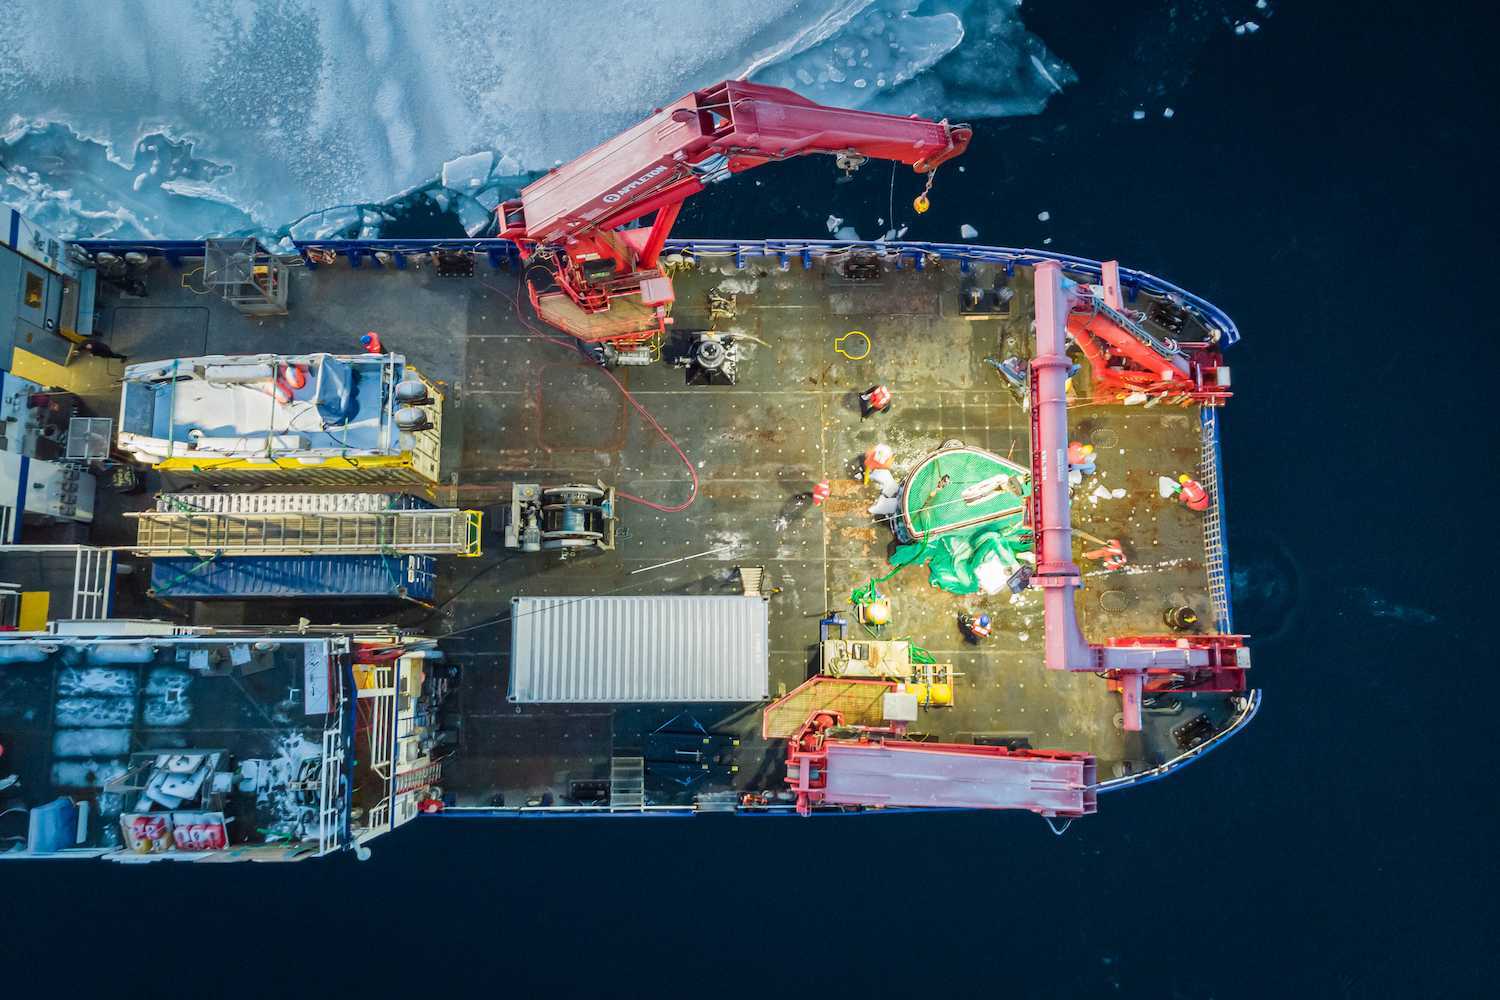
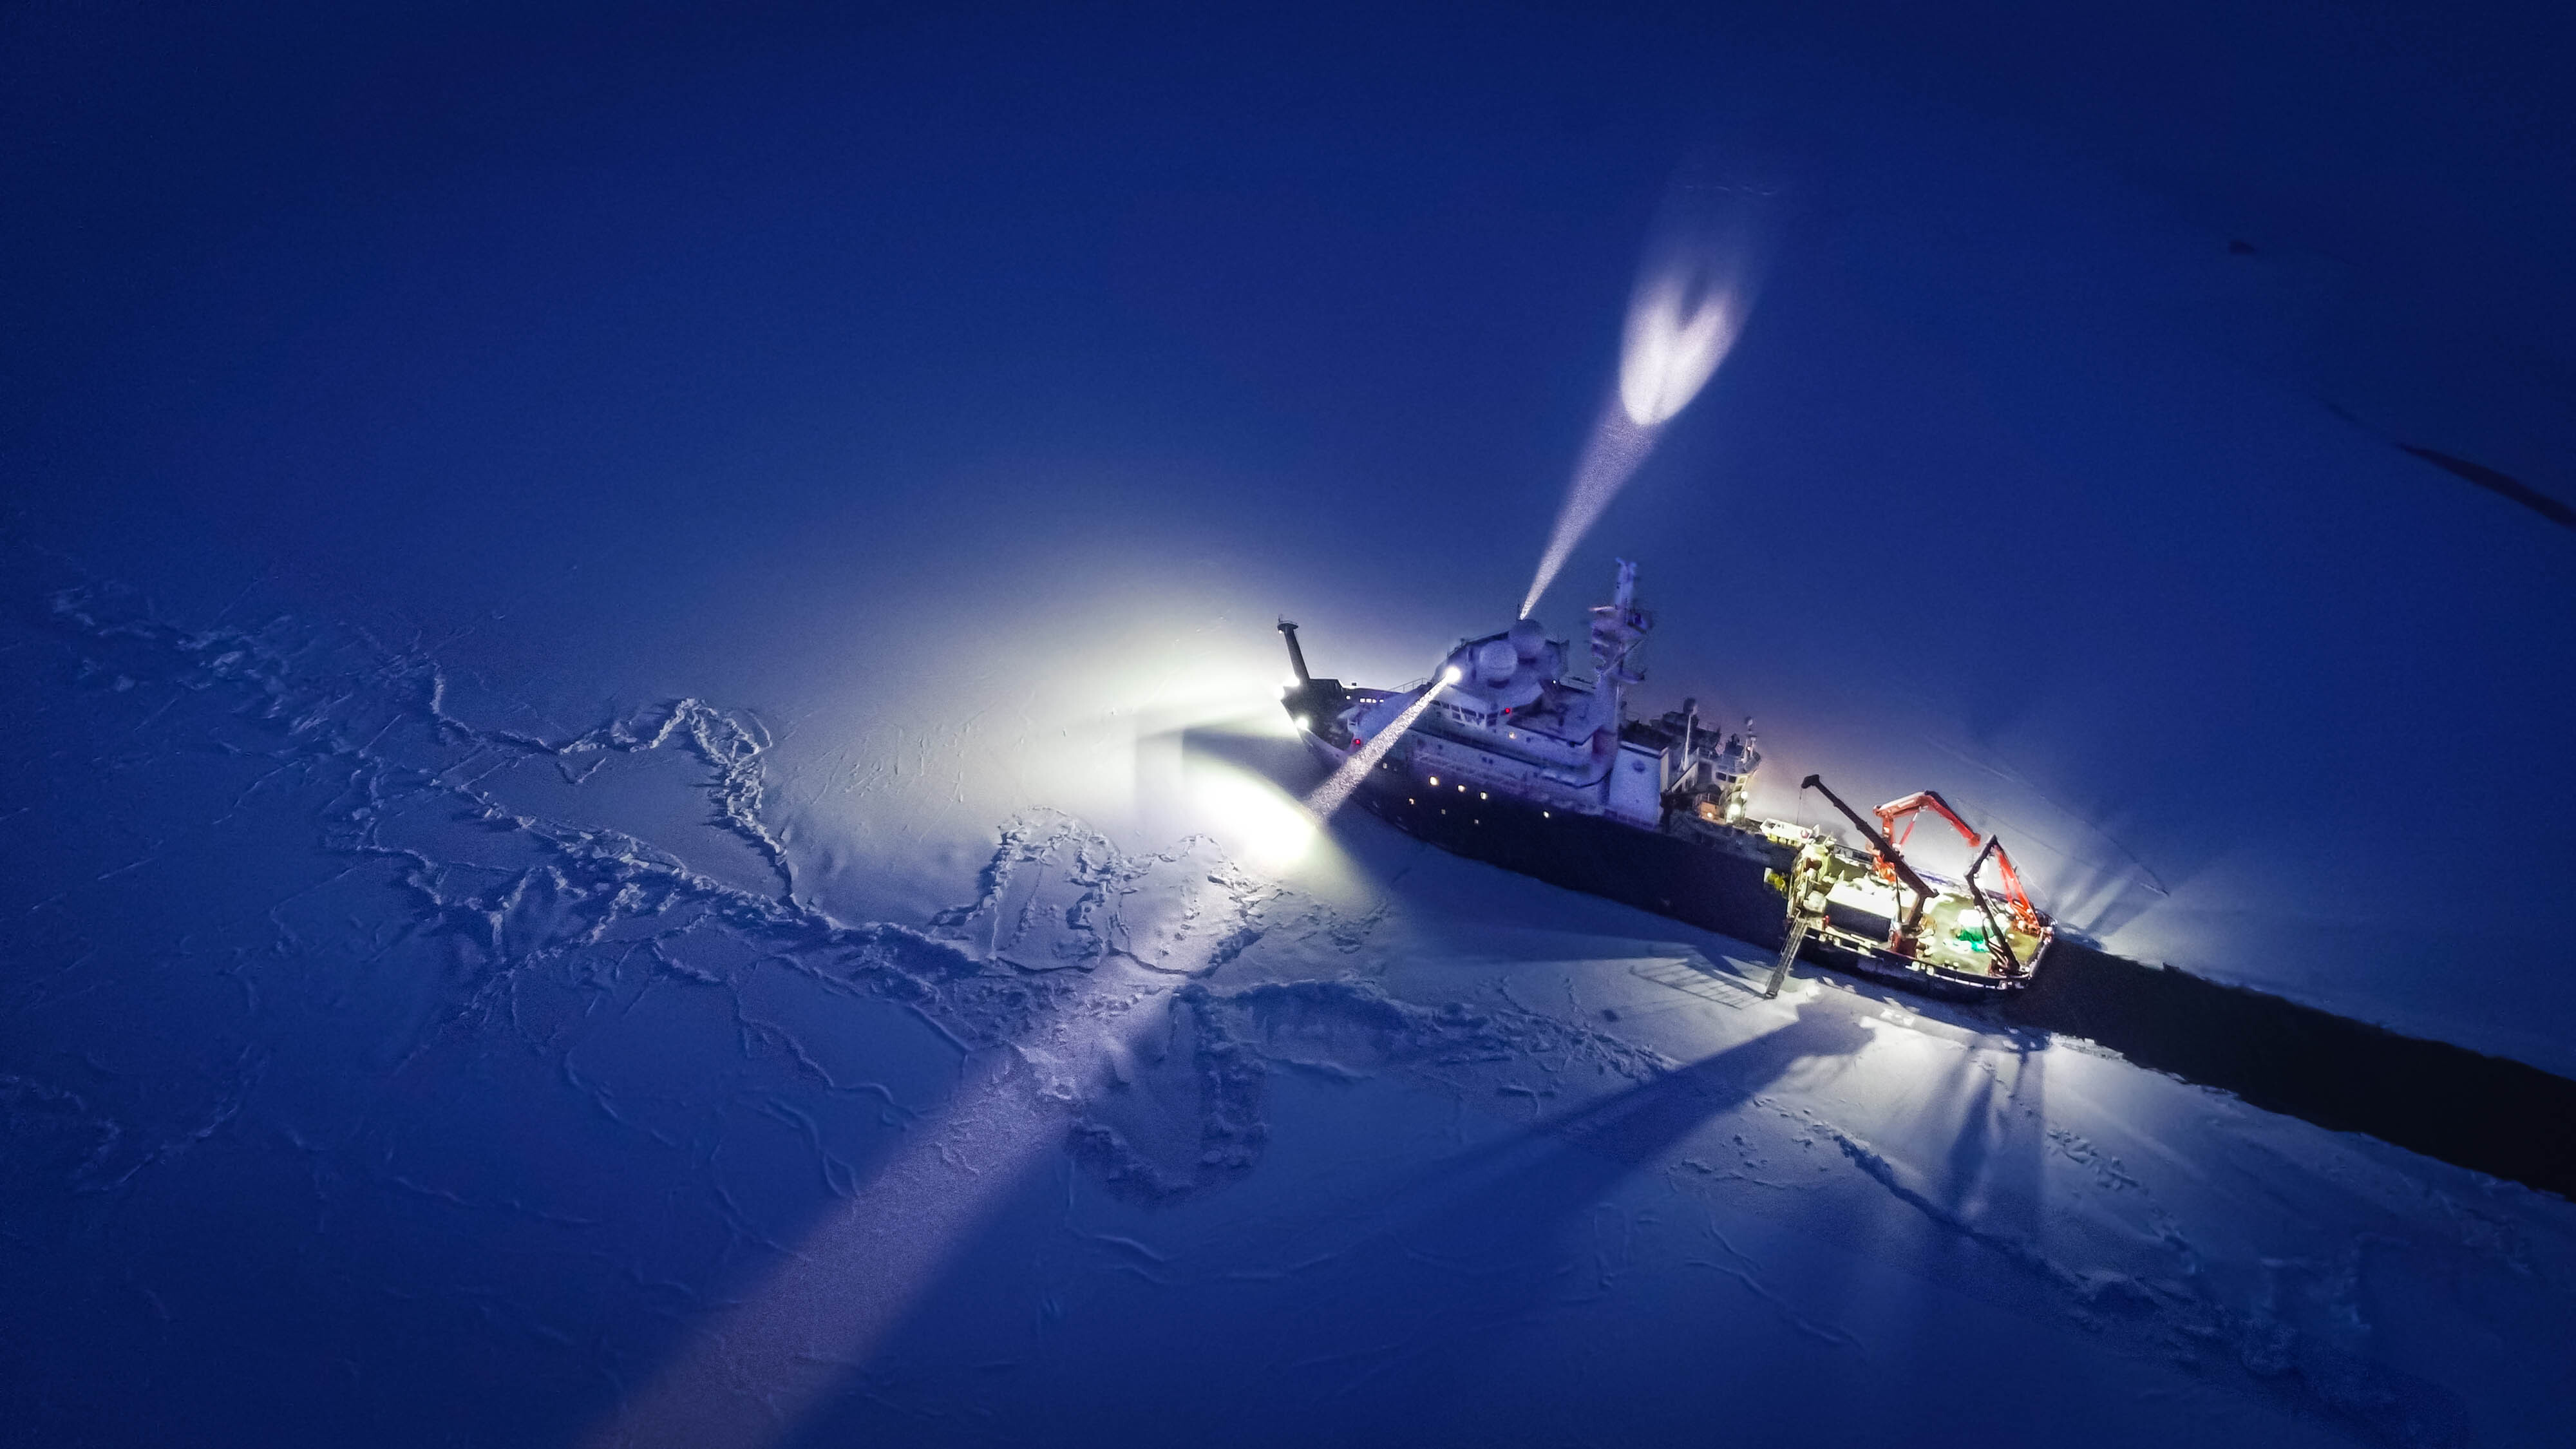
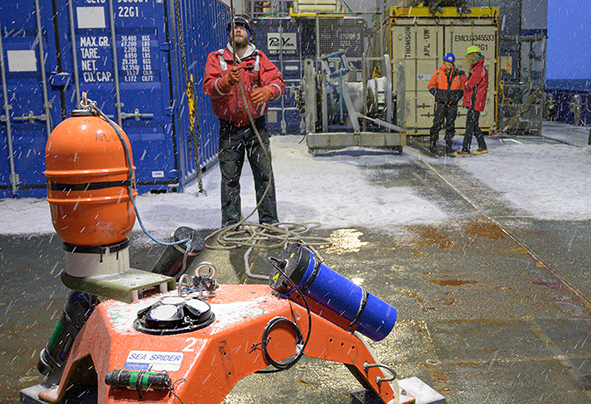
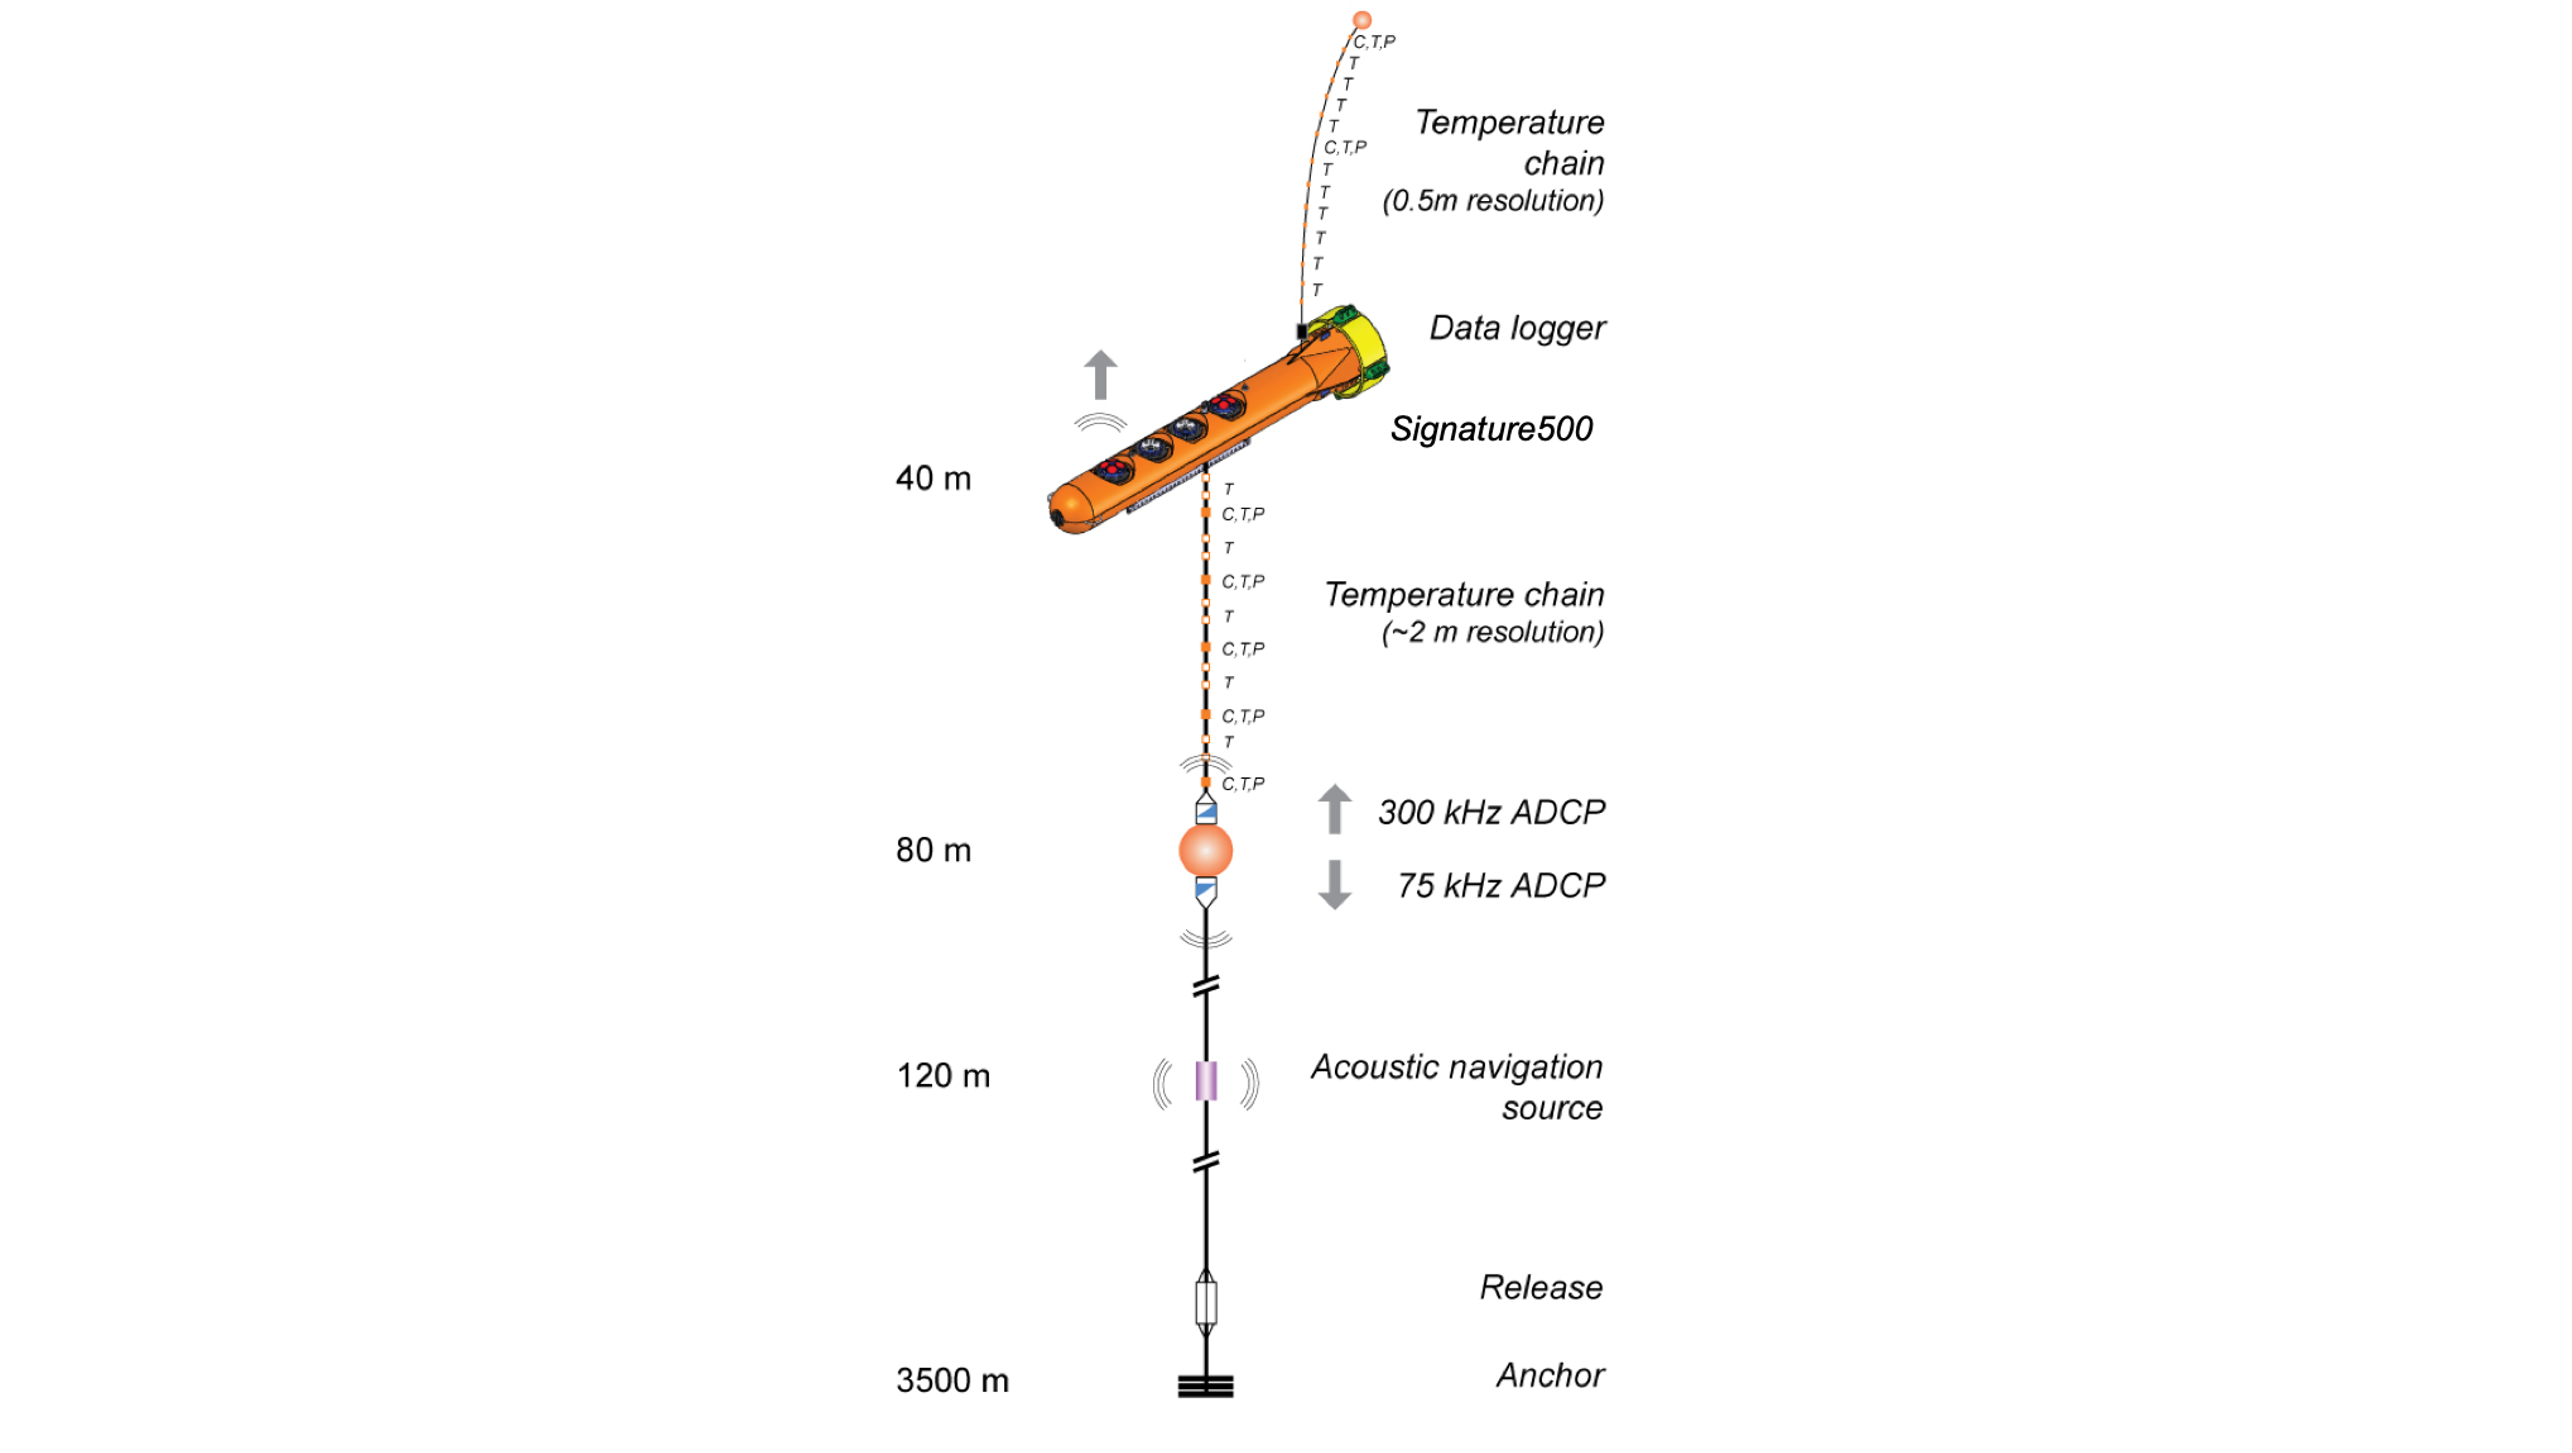
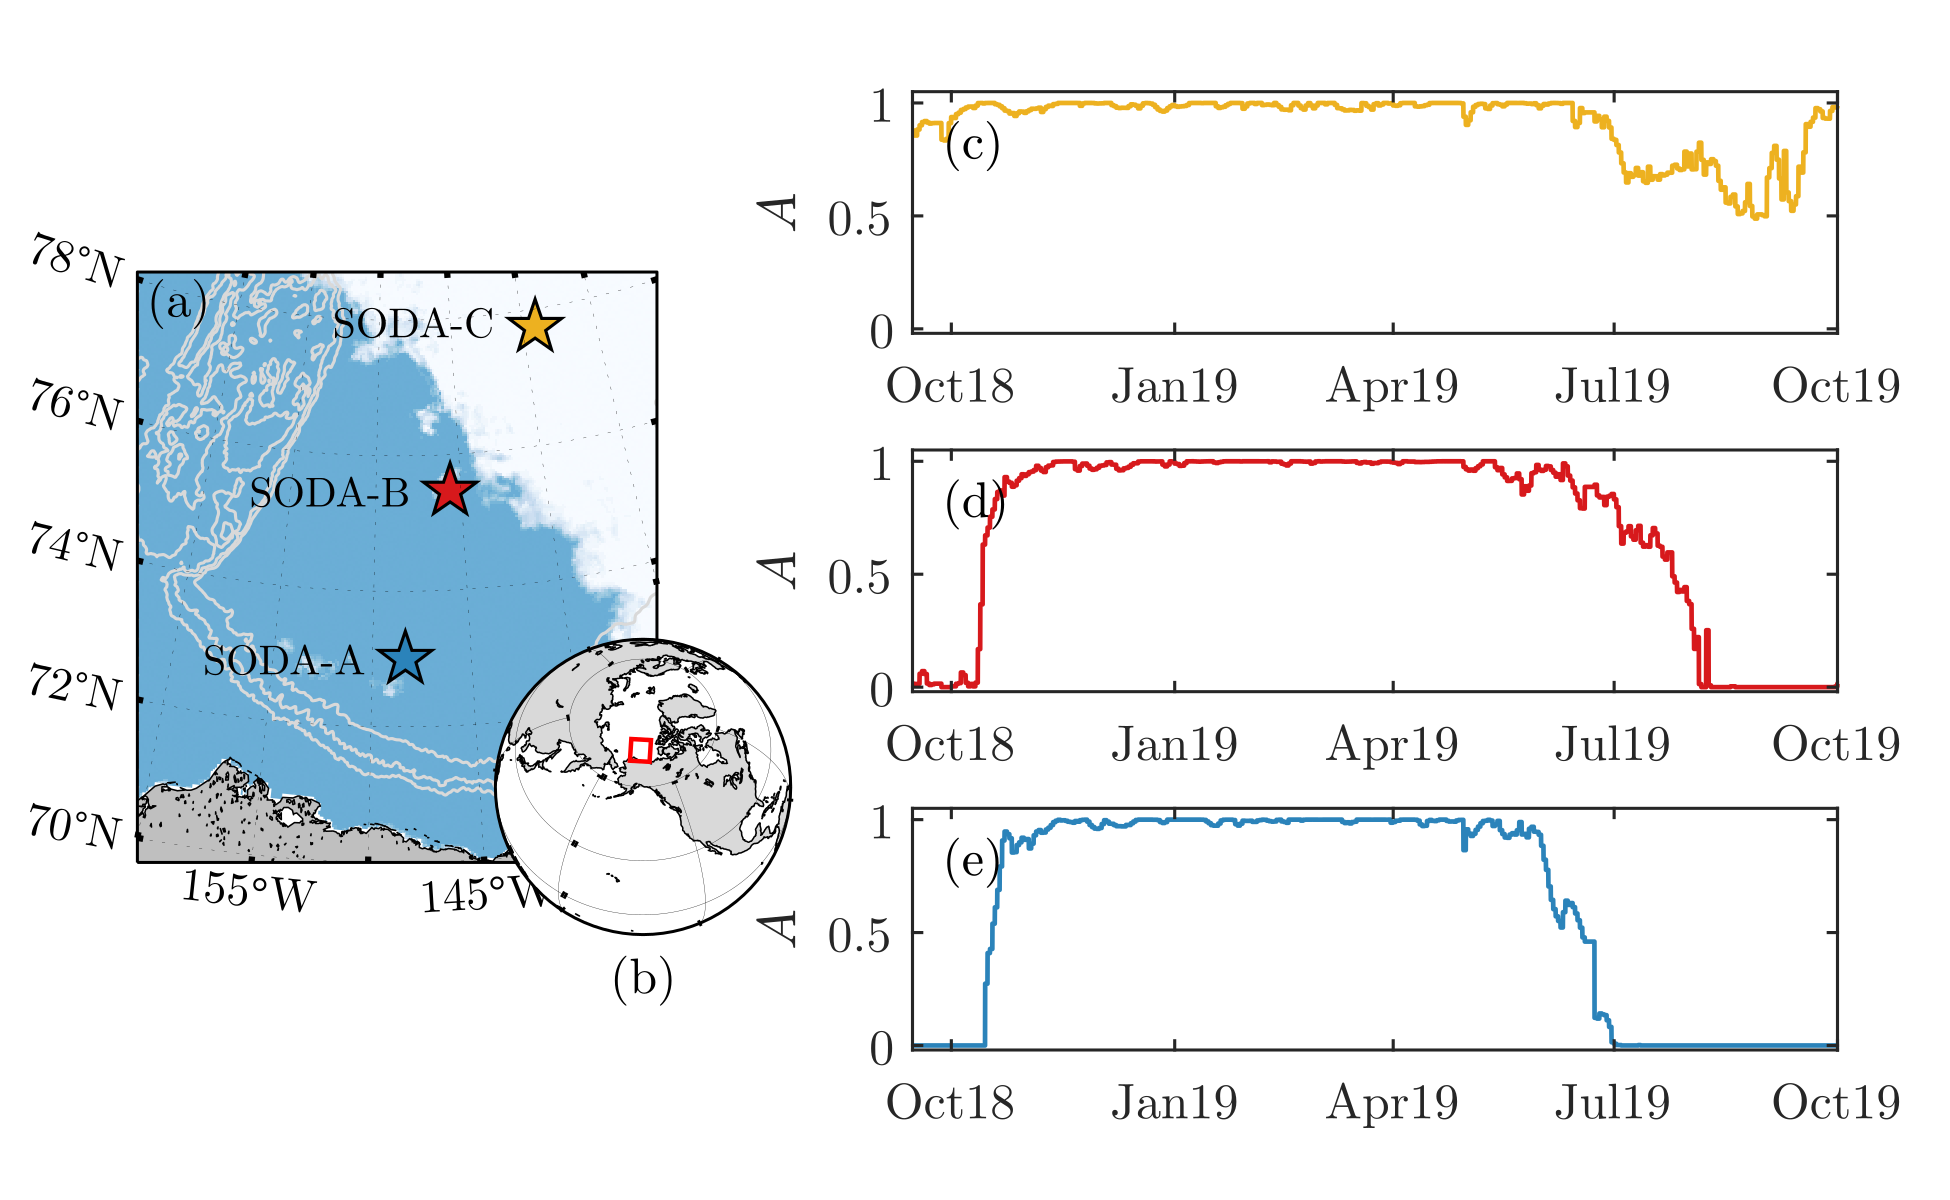
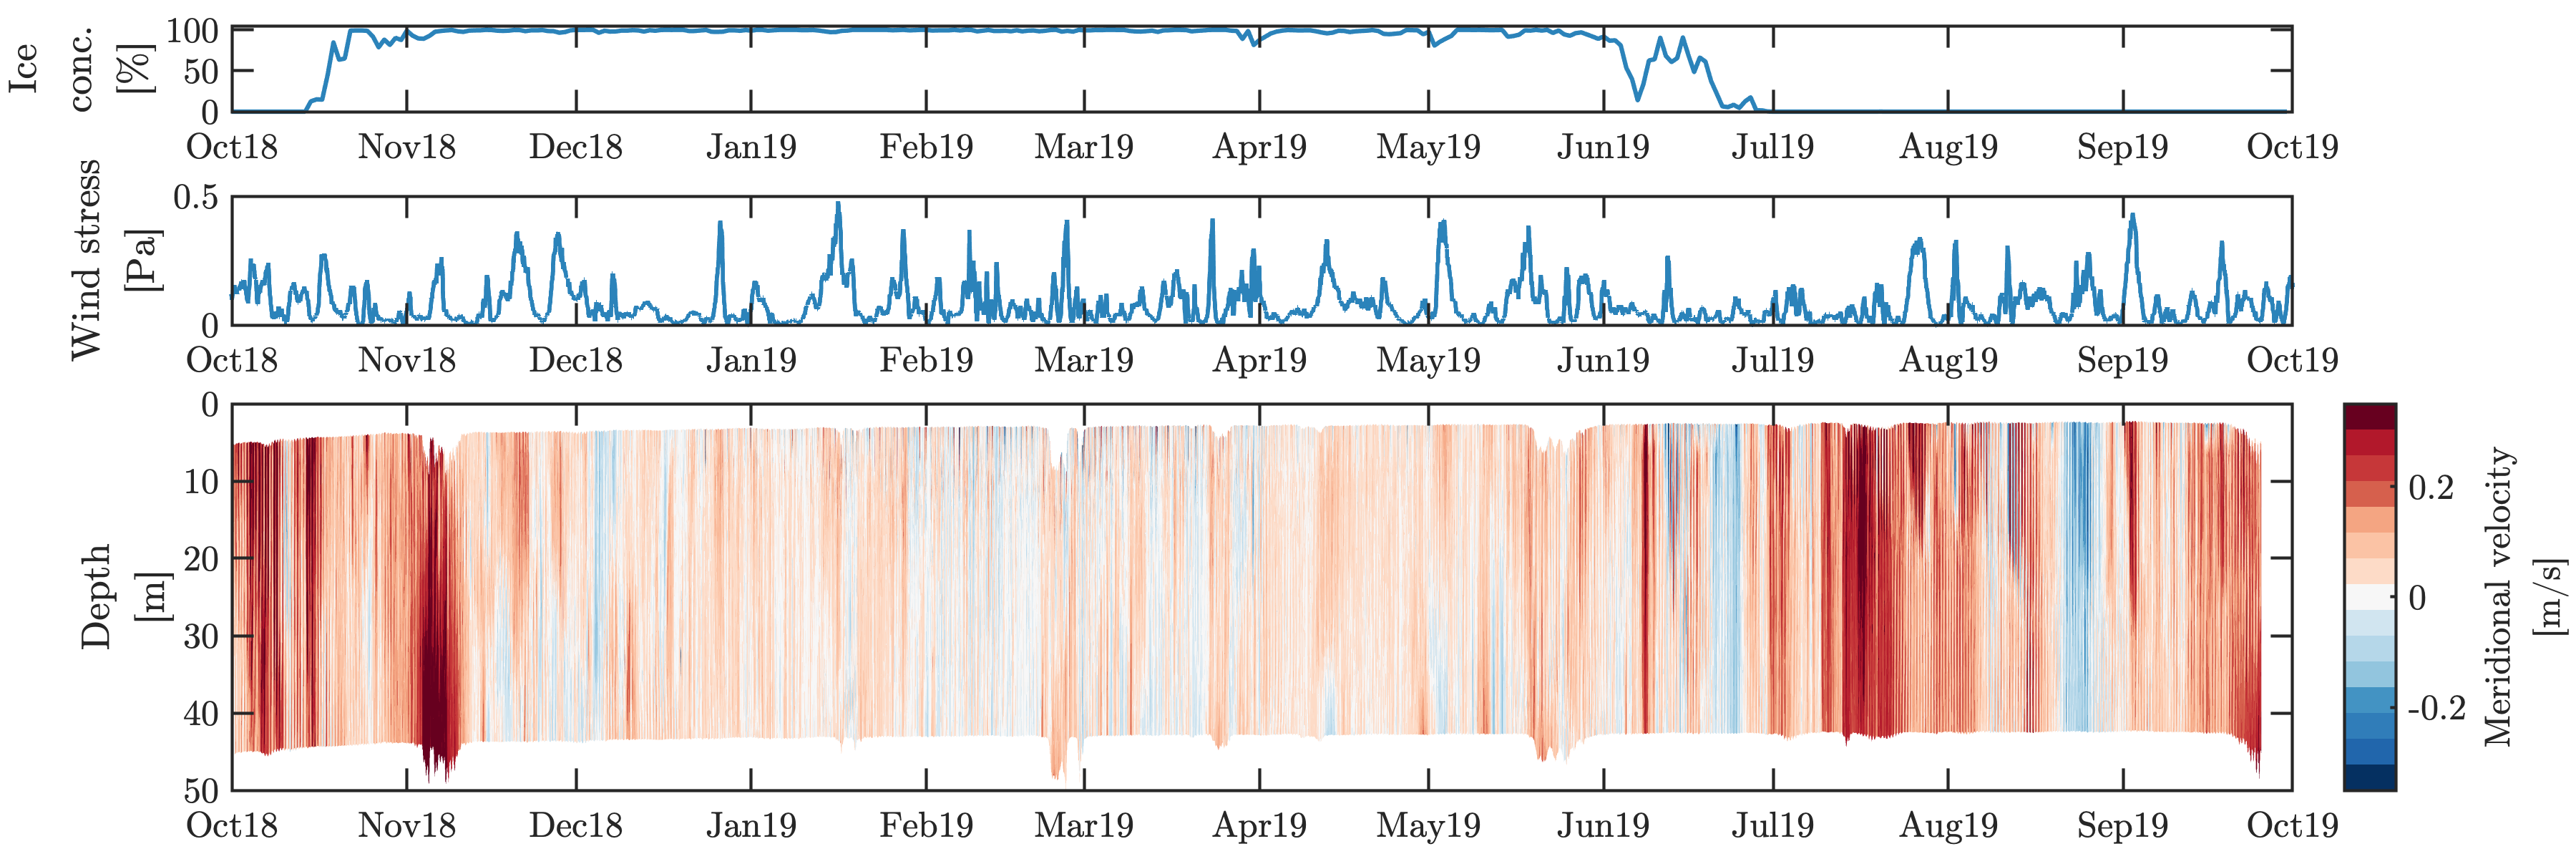
In the autumn of 2018, Brenner, Thomson and colleagues moored three Signature500 ADCPs on top floats in the Beaufort Sea at depths of between 27 and 45 m, each in separate locations chosen to sample different sea ice regimes. Left in situ for a year, the instruments collected one minute (sixty samples) of velocity, current and altimeter measurement every ten minutes using an inbuilt sampling scheme for measuring the ocean and ice together, and around seventeen minutes (2,048 samples) of altimeter measurement every two hours using a sampling scheme designed for measuring waves.
During the ice-free periods, the wave sampling scheme provided wave data for other studies, but during the ice phase, the measurements were leveraged for Brenner’s sea ice geometry work.
“In some way we’re getting double our mileage with Nortek’s wave sampling mode,” says Brenner.
“Getting a whole year of data lets us see the ice retreating in the summer, and then coming back in the autumn and then getting thick and growing throughout the winter, and then melting again in spring. That seasonal cycle is key to understanding the Arctic,” Thomson says.
Why long-term deployments in the ocean need robust ADCPs
Nevertheless, leaving instruments in the ocean for a year without access to any of the data can be stressful at the best of times, but for Brenner, whose dissertation relies significantly on the data, it was particularly nerve-wracking.
“There are all sorts of external factors that can go wrong, that you just don’t have any control over. So, you do your best and try to manage risks, but you never really know,” says Brenner.
When Brenner retrieved the ADCPs and their precious data, his worst fears were allayed. “We got awesome data back, and the instruments worked exactly the way that I programmed them to without any issues,” Brenner says.
Using the ADCP data for in-depth understanding of sea ice
The data Brenner obtained has allowed him to quantify the number and extent of leads (large cracks between ice floes), the draft of level ice (the depth the ice reaches below the sea surface), the number, size and spacing of keels (ridges on the underside of the sea ice), ice drift (the movement of the sea ice across the sea surface) and ocean currents.
Between the remoteness and harsh conditions, Arctic sea ice data is sparse. “We have a satellite base, which is great because it gives you that aerial cover, but we don’t have much in the way of in-situ data – the real field observations – which I think are just absolutely critical for understanding this system,” Thomson says.
Brenner’s work, which has been published in the peer-reviewed science journal JGR Oceans (open access preprint available at ESSOAr) has provided some of those much-needed real observations and insights into sea ice’s spatial-temporal dynamics in the Beaufort Sea. For example, he found that ice-ocean drag – the efficiency of the wind and currents in pushing and pulling the ice – varied between the three locations and thus ice regimes, and between seasons.
ADCPs help identify how model predictions deviate from what actually happens in the ocean
In terms of models, Brenner was able to identify where and when model predictions deviated from what actually happens out in the ocean. The primary reason for the mismatch between observed and predicted values is that models aren’t so good at predicting sea ice’s rugosity, which results in a tendency to overpredict drag efficiency while the ice is melting.
Given sea ice is melting earlier and forming later with climate change, refining the geometry parameters in ice models can also help refine climate models.
“We’ve seen that our fundamental understanding of these systems, which is built into models, is on track, and now have a set of questions and priorities we can target for making the next generation of models even better,” says Brenner.