Improving metocean forecasts with wave and current data from an extreme ocean environment
- User stories
Synopsis
Challenge
The Lofoten Maelstrom is a notoriously dangerous and difficult area for seafarers. The fast currents, powerful waves and turbulent eddies are synonymous with causing shipwrecks.
Solution
A research team at the Norwegian Meteorological Institute teamed up with Nortek to quantify this severe environment using Signature ADCPs.
Benefit
Quantifying and understanding this environment allows for better metocean forecasts, thus improving safety for seafarers in the future.
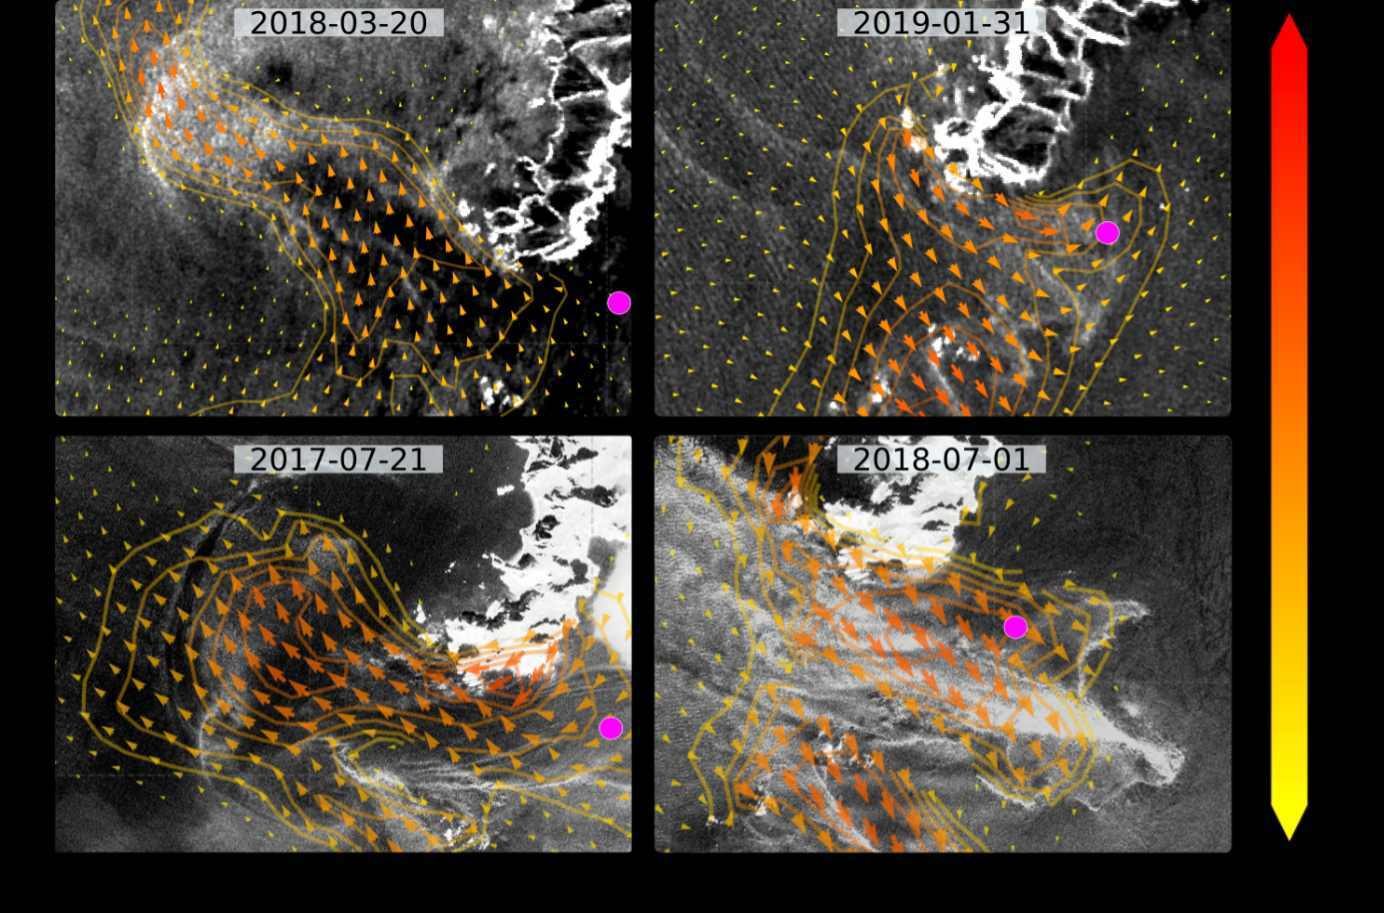
In the north of Norway lies the Lofoten archipelago, home to one of the world’s strongest open-ocean tidal currents. The Lofoten Maelstrom, known locally as Moskstraumen, is generated by large differences in tidal amplitude between the Vestfjord and the Norwegian Sea.
The fast-flowing currents, powerful waves, eddies and whirlpools have inspired short stories and books, such as Edgar Allan Poe’s A Descent into the Maelström and Jules Verne’s Twenty Thousand Leagues Under the Sea.
“This is a mythological place,” Dr Øyvind Saetra, deputy head of the Norwegian Meteorological Institute’s division for Ocean and Ice, explains.
Moskstraumen is a perilous and challenging place to research.
“The traditional way of measuring ocean currents is by having a mooring, with a line going from the bottom to the top of the ocean with different instruments attached. When you have 3 m per second current through the whole water column, the mooring will be destroyed,” says Saetra.
Obtaining a three-dimensional picture of ocean currents and waves
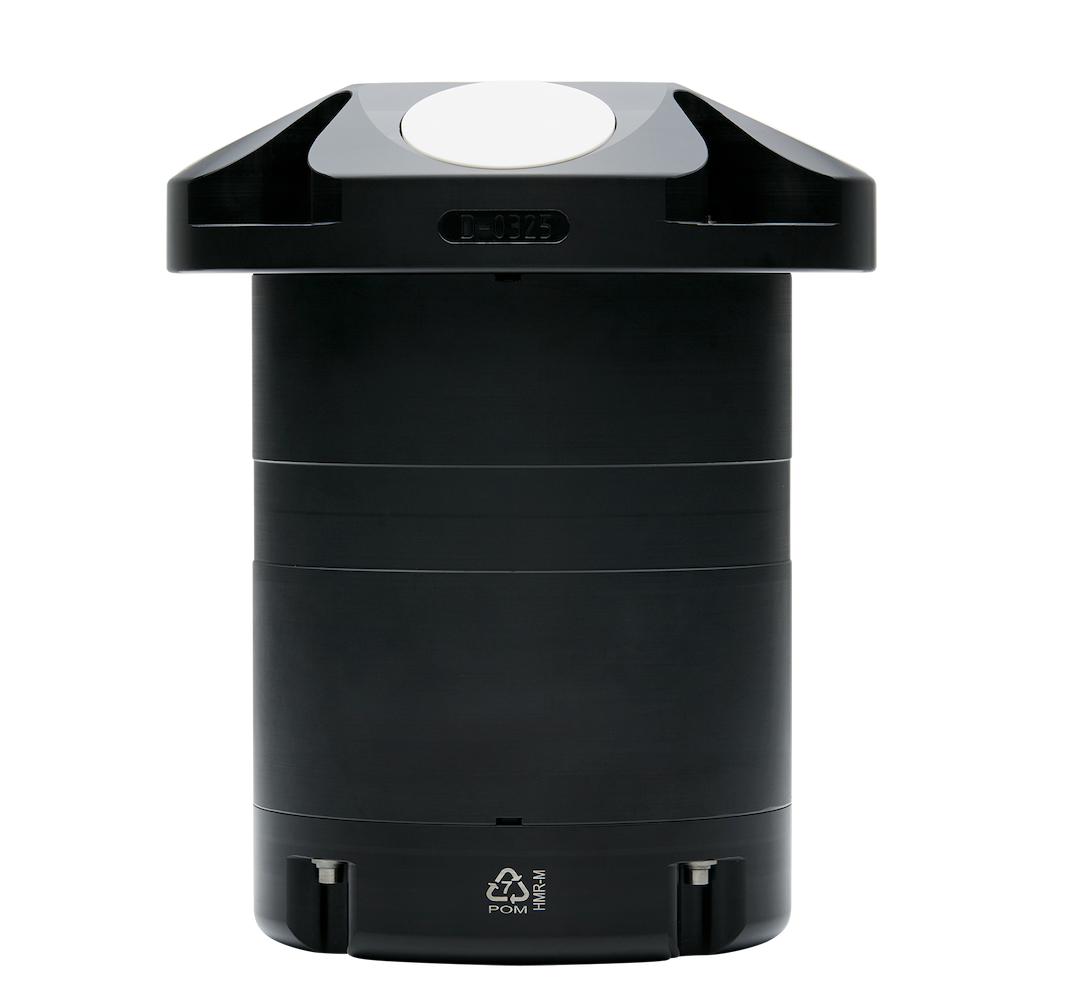
Acoustic Doppler Current Profilers (ADCPs) like the Signature500, however, do not have to be attached to a mooring. Mounted on a frame and placed on the seafloor where the instrument is less exposed, the Signature500 can collect detailed simultaneous measurements of the waves and currents throughout the water column.
“This technology is a game-changer,” Saetra says.
“You can put the instrument at the bottom of the ocean and measure not only the waves but also get a three-dimensional picture of the ocean currents at the same time.”
Creating a unique dataset to forecast oceanographic conditions
Accurate data are crucial to unlocking the mechanisms that govern this unique system. They are also essential for validating and calibrating numerical ocean models that can forecast Moskstraumen conditions. These improvements will improve metocean forecasts of strong currents and waves that can create dangerous situations for seafarers in the vicinity of the maelstrom.
Despite the difficulties, the team was able to collect sufficient high-quality data to uncover new and unexpected findings.
Firstly, we have the dataset of simultaneous measurements of waves and currents itself – a first for Moskstraumen.
“It’s very rare that you get simultaneous observations of waves and currents, especially where you have such a strong tidal current,” explains Trygve Halsne, a scientist at the Norwegian Meteorological Institute and PhD student at the University of Bergen.
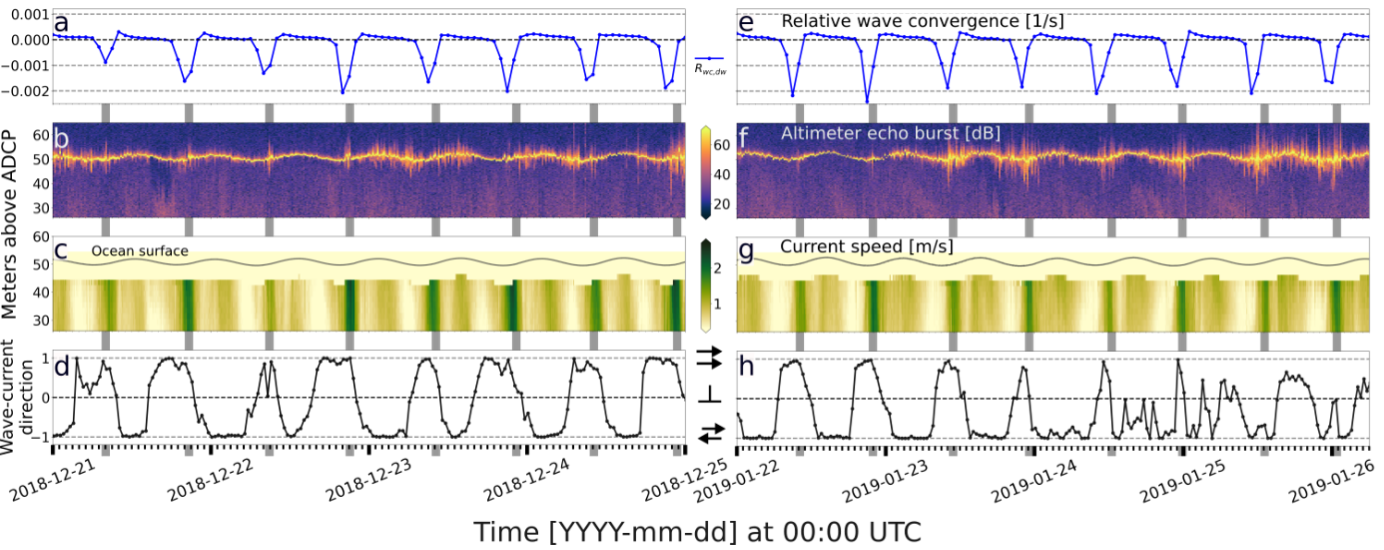
Wave and current data showed enhanced wave breaking
The study, published in the Journal of Physical Oceanography, confirms previous work suggesting currents can reach 3 m per second, although the scientists believe Moskstraumen’s speeds could be much faster than indicated. For context, current speeds of up to 2 m per second are usually considered to be exceptionally fast.
The team confirmed the system is barotropic (no vertical shear in current flow). In addition, the wave and current data showed enhanced wave breaking when the tide and currents move in the opposite direction, especially when the current is at maximum strength.
What the team did not expect to see was an enhancement of wave breaking when the waves and currents move in the same direction.
“When you talk to people like fishermen, they always say it’s when the current is opposing the waves that you get the strong breaks,” explains Saetra.
“However, we also saw strong breaks when the waves and currents moved in the same direction.”
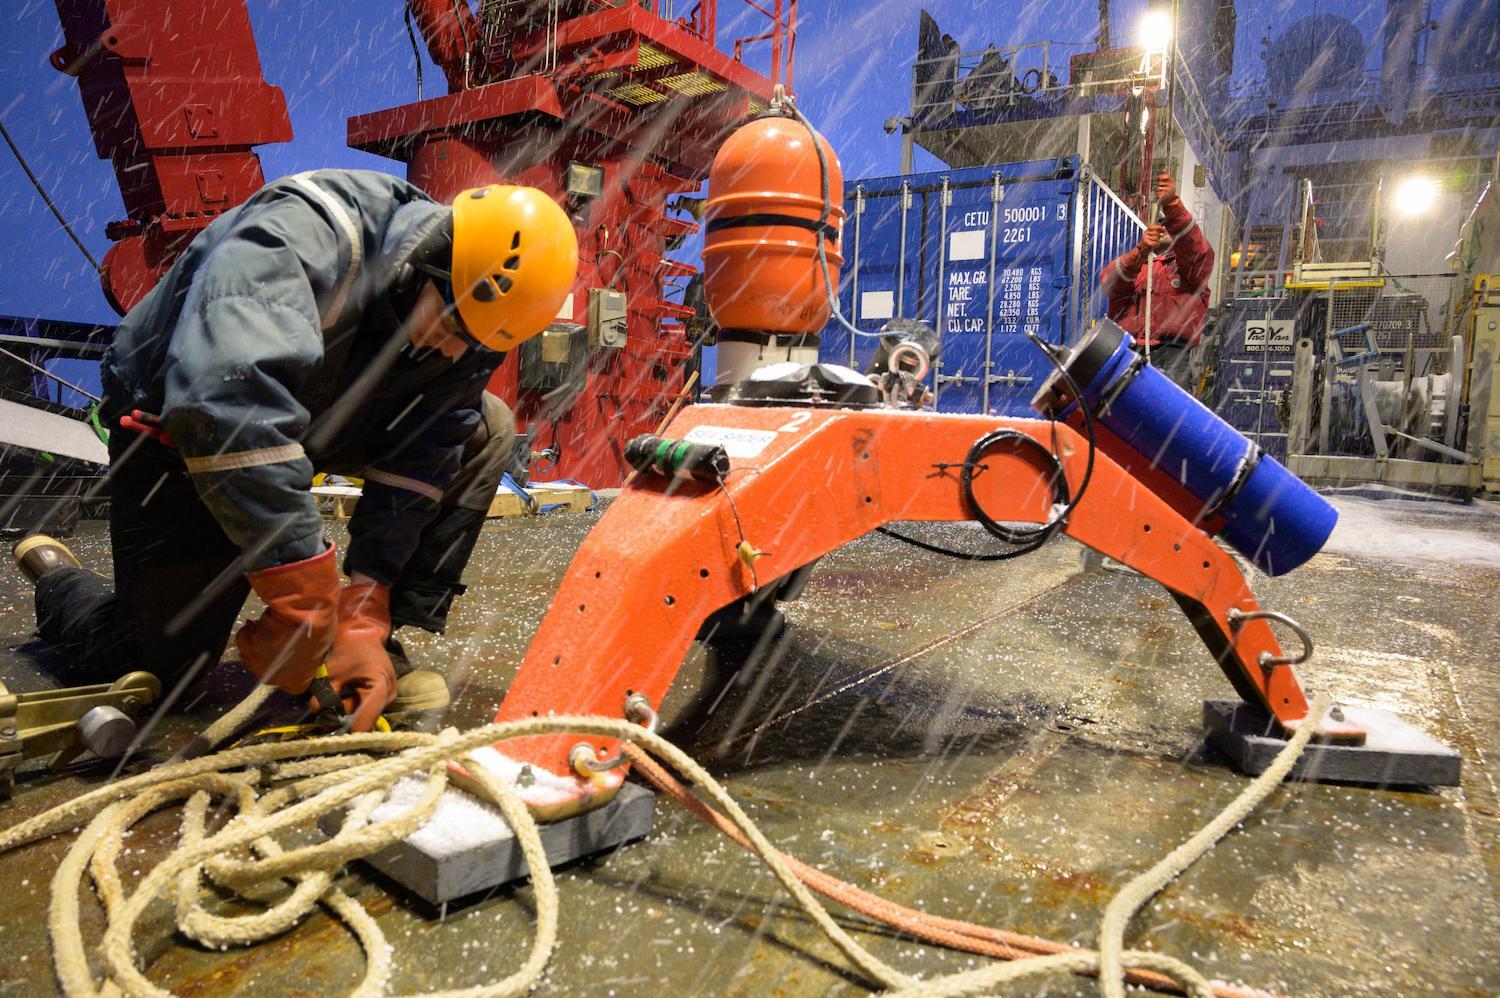
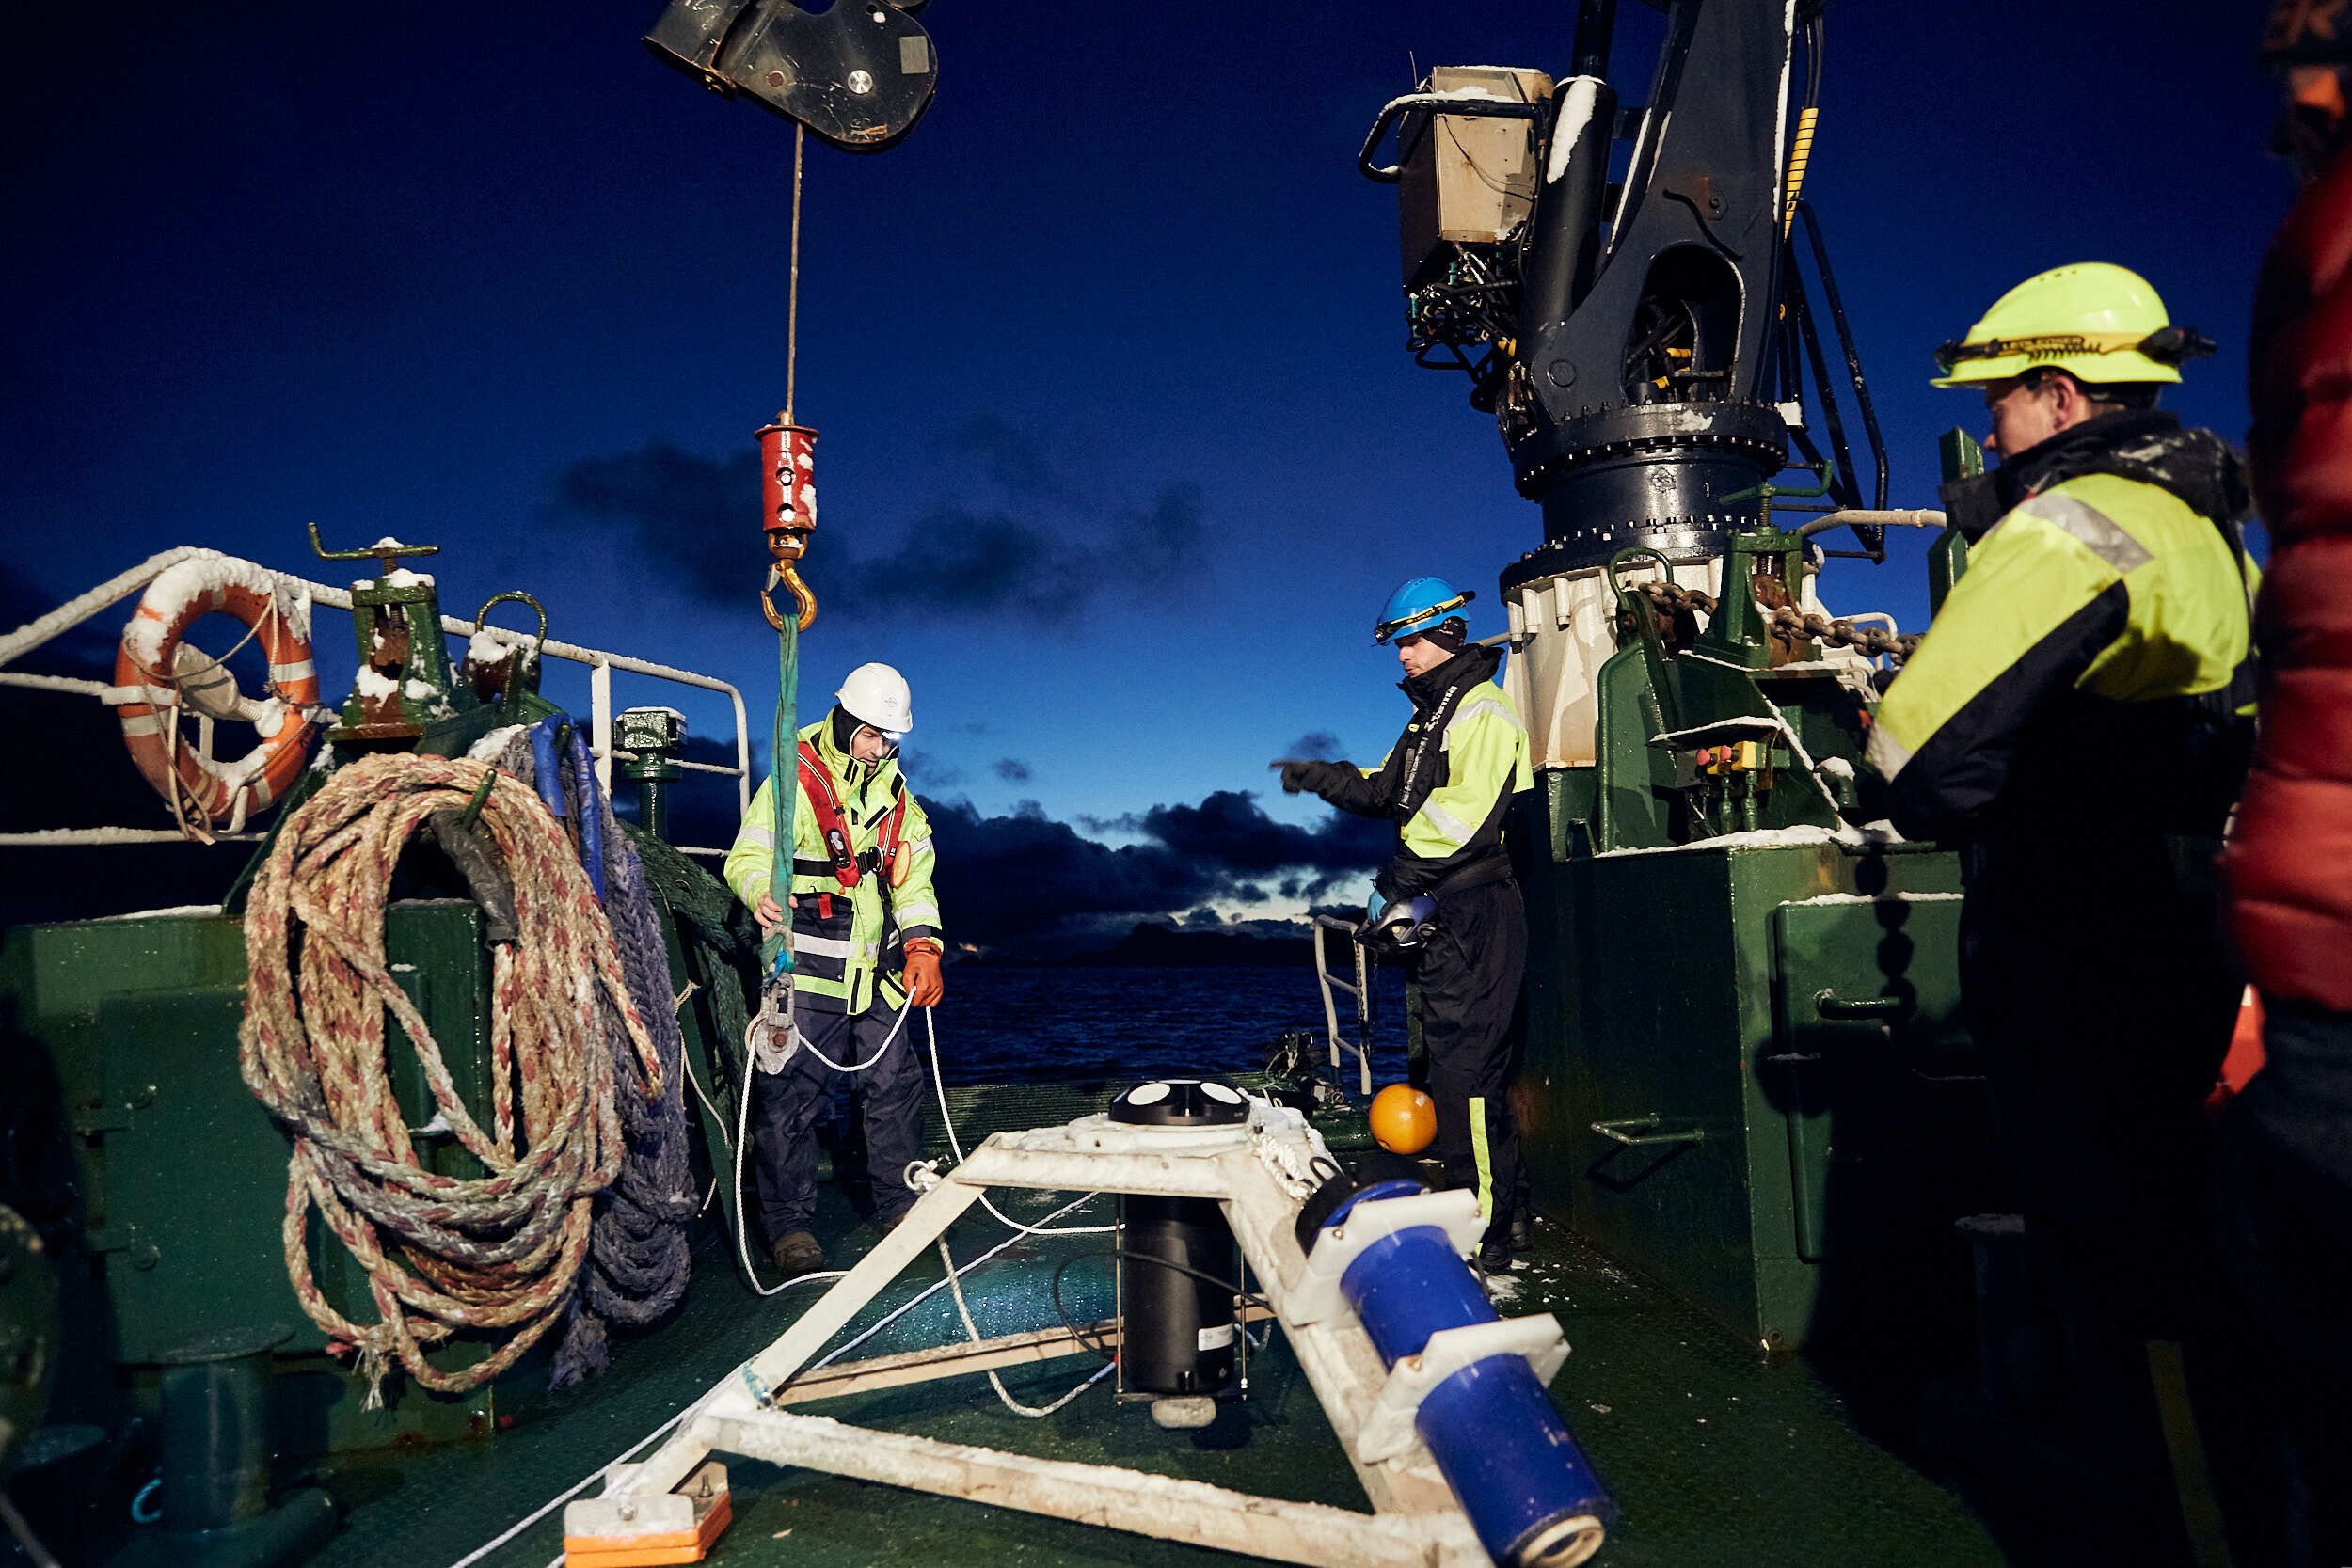
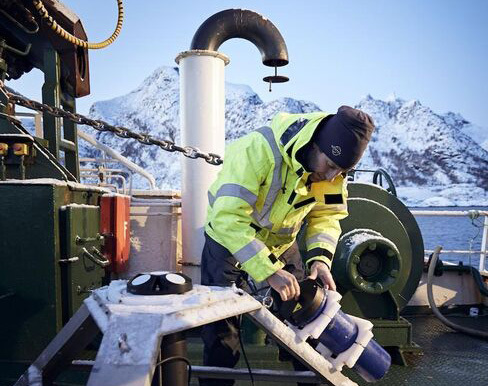
A difficult ADCP deployment in complex ocean currents
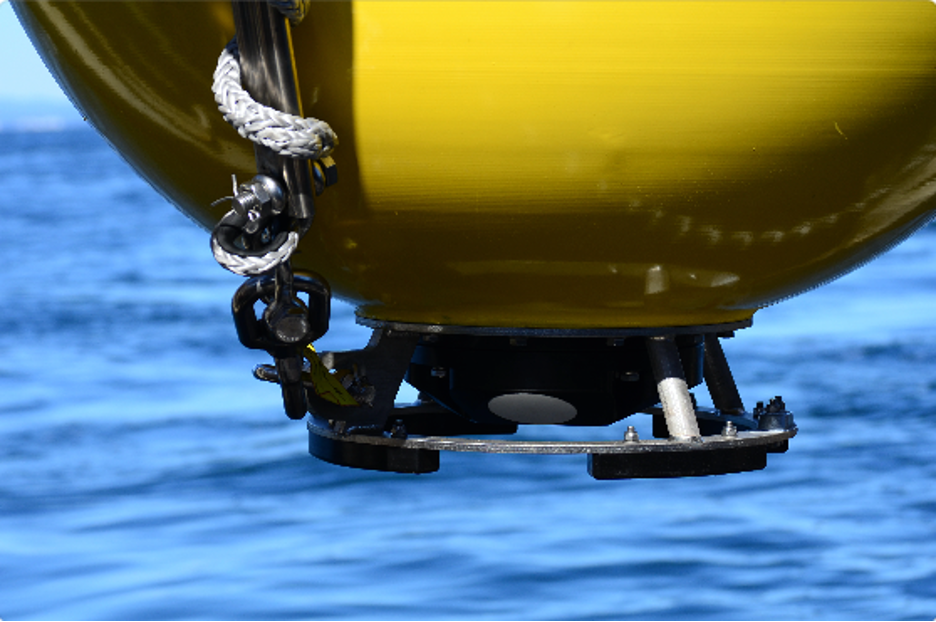
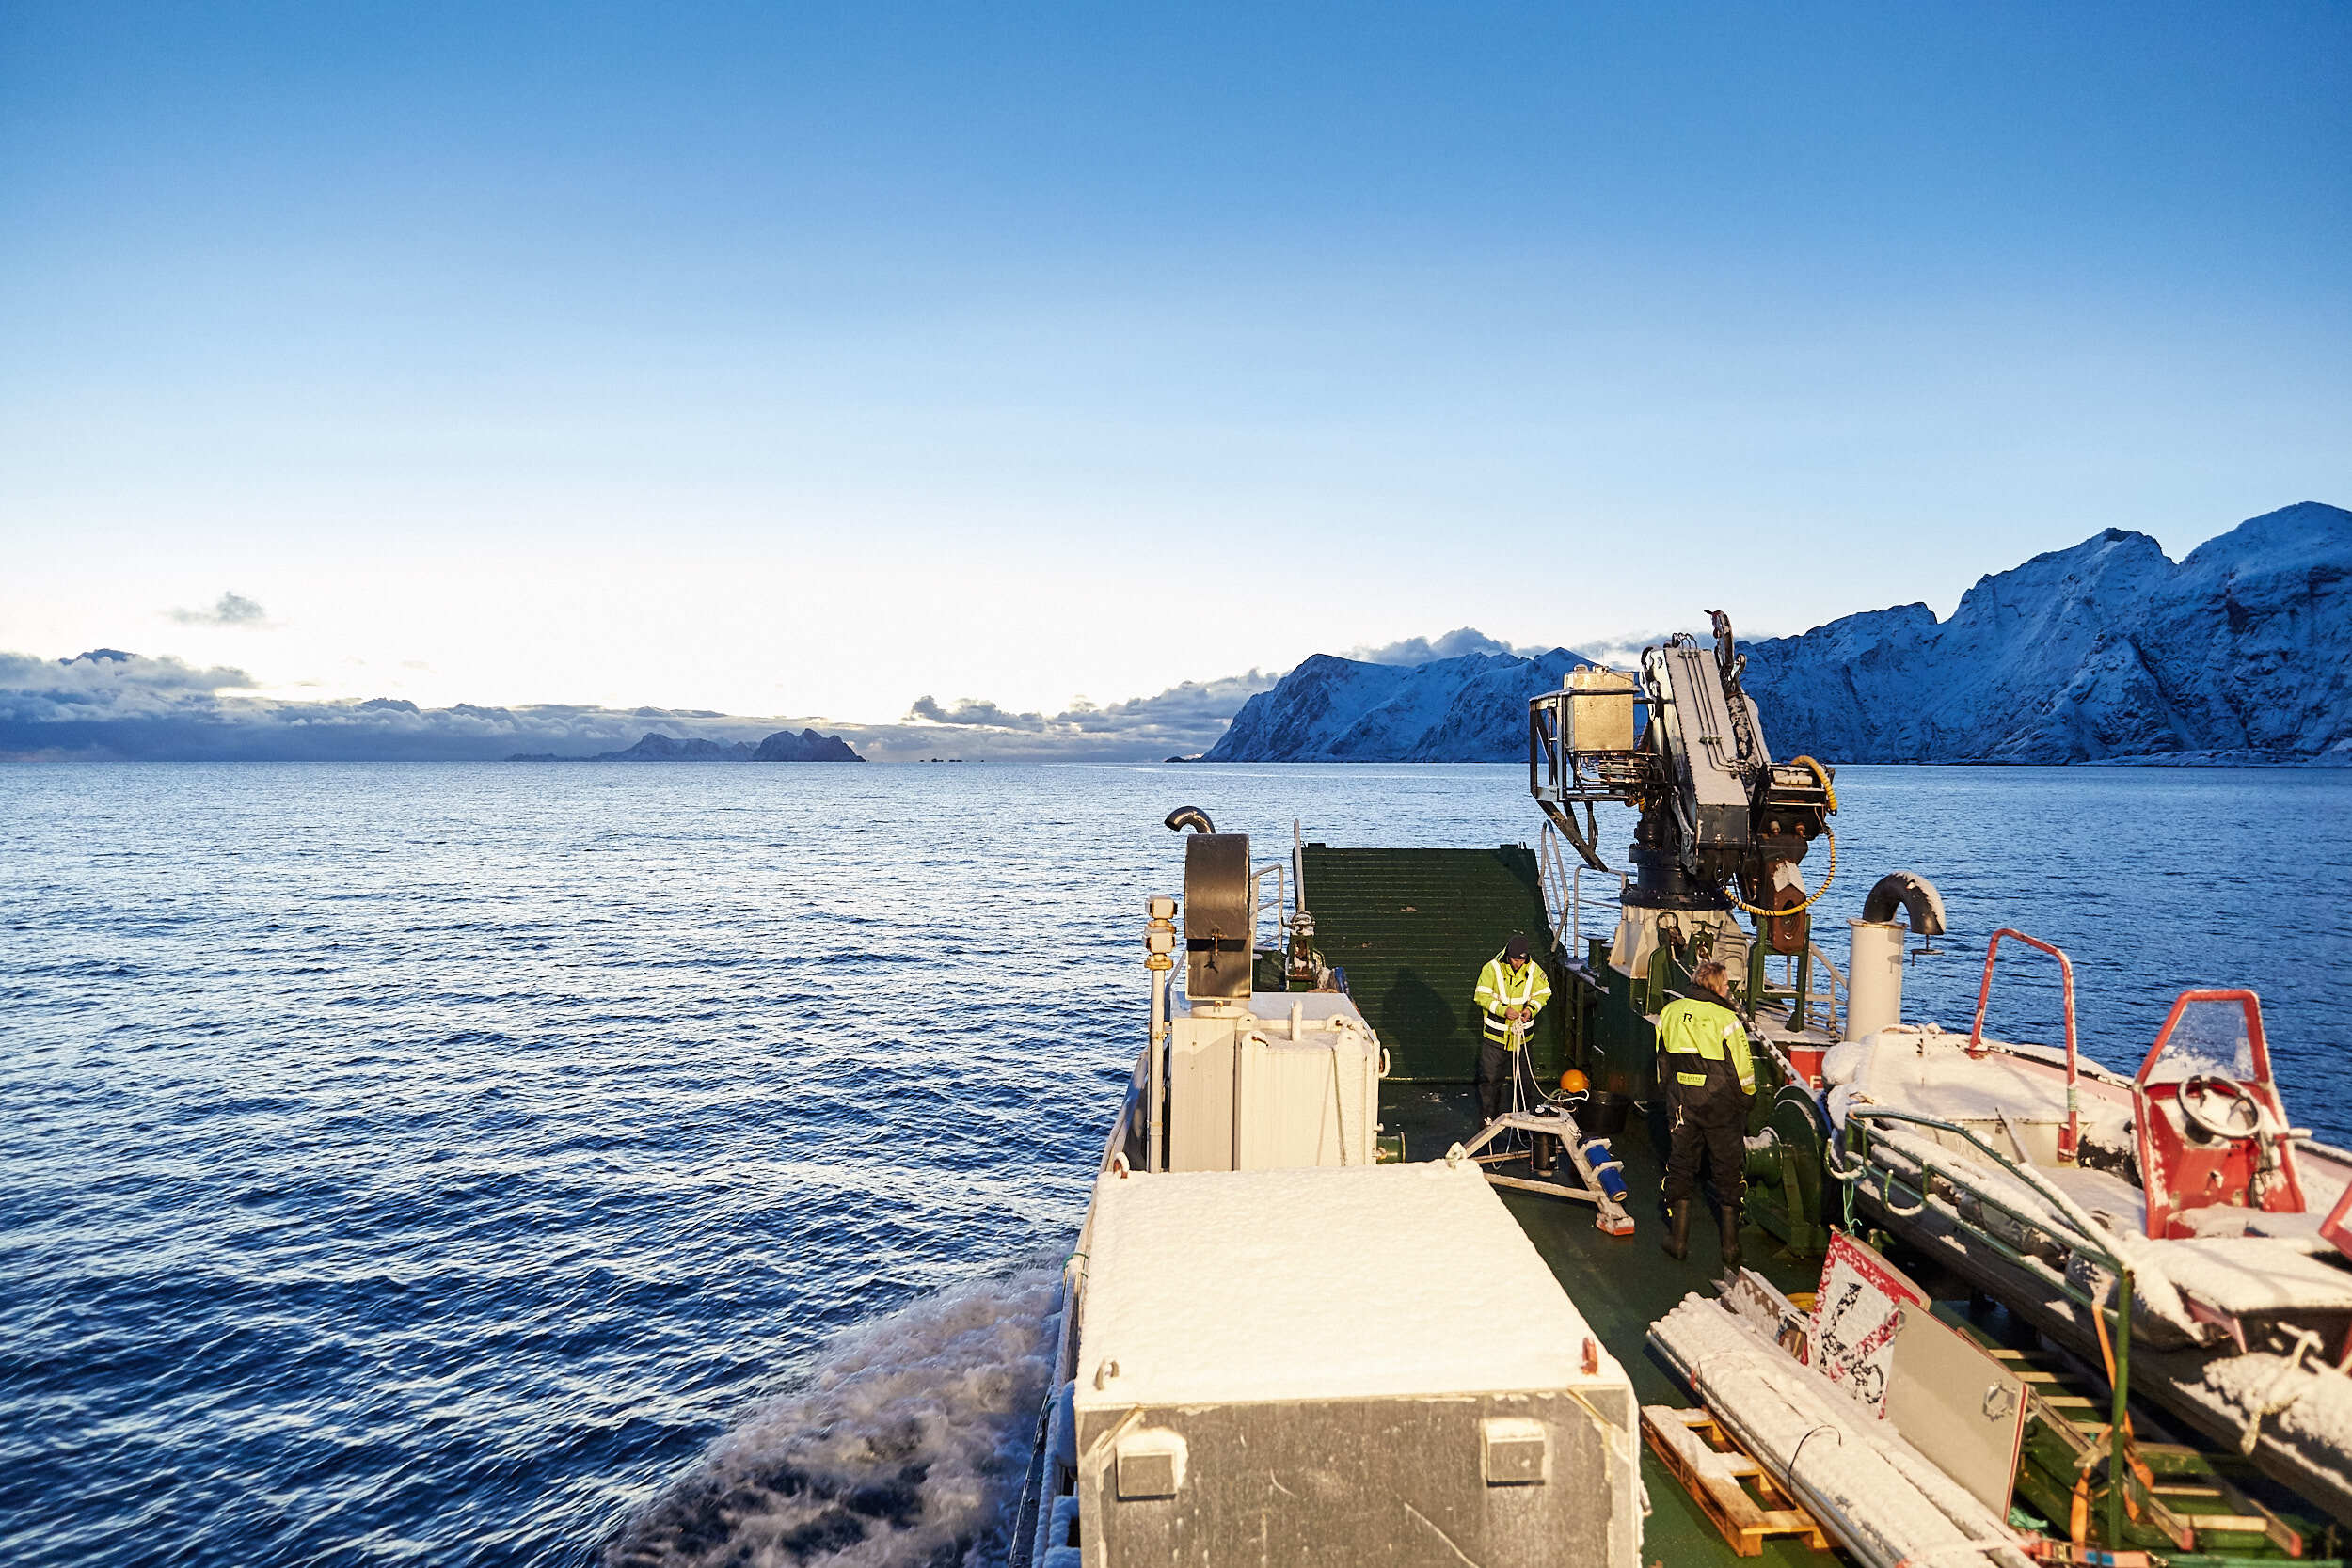
The scientists chose to deploy the Signature500 on a tripod in a gimbal at the entrance of the Vestfjord basin at around 50 m depth (the maximum depth range of the instrument). The Norwegian Coastal Agency provided the vessel and crew to deploy and later retrieve the ADCP. Tom Christian Ambrosius Mortensen, a field engineer with Nortek, joined the team to help with the deployment.
To unveil the physical processes of interest, the team set the ADCP to collect raw altimeter data and simultaneous wave and current data at two different sampling rates. As the team planned to leave the ADCP in the water collecting data for three months, they attached an additional battery to ensure the instrument would have sufficient power.
Even with the best-laid plans, environmental conditions can always present a challenge when conducting fieldwork and have to be closely monitored when on site.
“Because the current is extremely fast, we wanted to deploy when the currents would be minimized,” explains Tom Christian Ambrosius Mortensen.
However, unexpected events pushed the deployment much later than they hoped. With limited boat time available, “we had to go when the tide was flowing at the maximum, which made deployment more difficult.”
“We were able to get the instrument down safely, but we discovered later that it tilted when the currents were particularly strong,” Mortensen says.
“Because time was limited, we did not have the opportunity to attach side plates to the tripod so that we could protect the instrument/gimbal from tilting and wobbling in strong currents.”
Assuring ADCP data quality from extreme currents
Data processing and quality control are essential steps in any research, but here, where tilting was a particular issue, this step became particularly vital. Using Nortek’s OceanContour software, Torstein Pedersen, a specialist in wave measurements at Nortek, processed and corrected the data collected by the ADCP.
“There are algorithms that clean up the data and count how many false signals there are, but sometimes you have to visually scrutinize the data too. This is especially true when looking at extreme events,” Pedersen explains.
When the tilt becomes too large, data can become unreliable. Pedersen discounted wave data collected when the instrument tilted more than ten degrees. Other controls Pedersen performed included checking directional estimates.
“The currents modify the waves in amplitude, period and direction,” he explains. “I had to make sure that we had something sensible coming out.” With the tilting in mind, Pedersen also helped with interpreting the data.
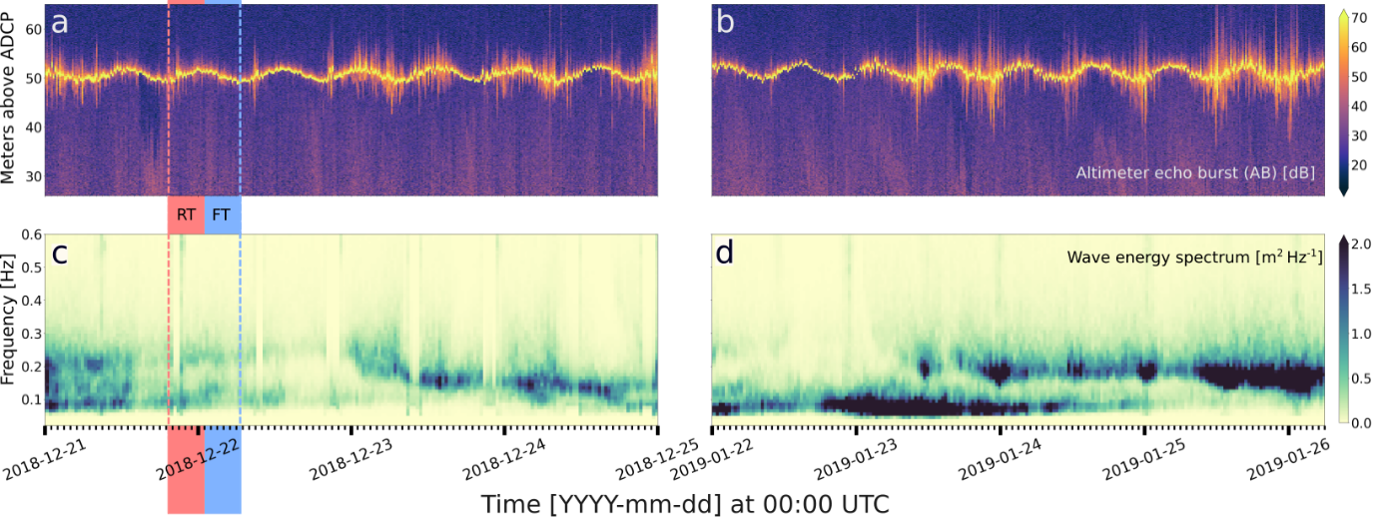
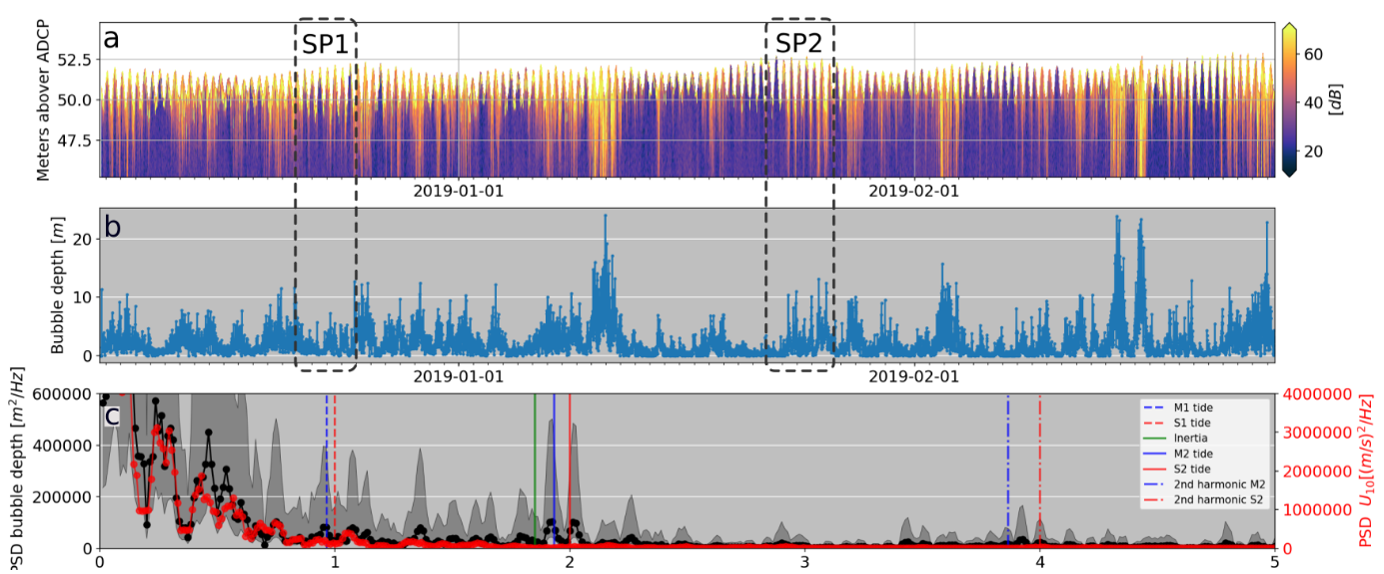
Bubbles from waves inform wave height and energy dissipation
With instrument tilting causing some issues with wave height measurements, the scientists had to be more creative in building this dataset. Signature instruments are equipped with a vertically oriented echosounder that can measure the distance to the surface and backscatter in the water. When analyzing the data, the team realized that they could see bubbles created from waves breaking at the surface with this beam.
“We found out that we could use bubble penetration as a proxy for wave height,” Halsne says.
“The larger the breaking wave, the deeper the bubbles penetrate the water column.”
This bubble penetration data had another benefit. It allowed the scientists to quantify energy dissipation.
“Every time a wave breaks, you lose energy. To get the energy balance correct in the wave models, you really need to have a very good description of the waves breaking,” explains Saetra.
The rate of wave energy change results from wave propagation and dissipation, which occurs when waves break.
“The largest unknown is dissipation, because historically it has been very difficult to measure,” says Saetra.
Making bubble penetration sampling from waves more accessible to the research community
For Halsne, the Signature’s ability to measure bubble penetration depth for wave height proxy and dissipation calculations has importance beyond this particular study.
“I think after this work, [bubble penetration sampling] will become much more interesting and accessible to the research community,” he says.
Also read the scientific paper "Resolving regions known for intense wave–current interaction using spectral wave models: A case study in the energetic flow fields of Northern Norway" on ScienceDirect.com.