Exploring Mediterranean Sea waters with a state-of-the-art combined current profiler and echosounder
- User stories
Synopsis
Challenge
Gathering vessel-mounted current measurements in areas of variable depths requires a flexible instrument.
Solution
The Signature 100 ADCP was tested using its multi-frequency capabilities as well as combined echosounder.
Benefit
Both long-range, lower-resolution measurements and shorter-range, higher-resolution measurements, as well as echograms, can all be taken from one vessel-mounted instrument.
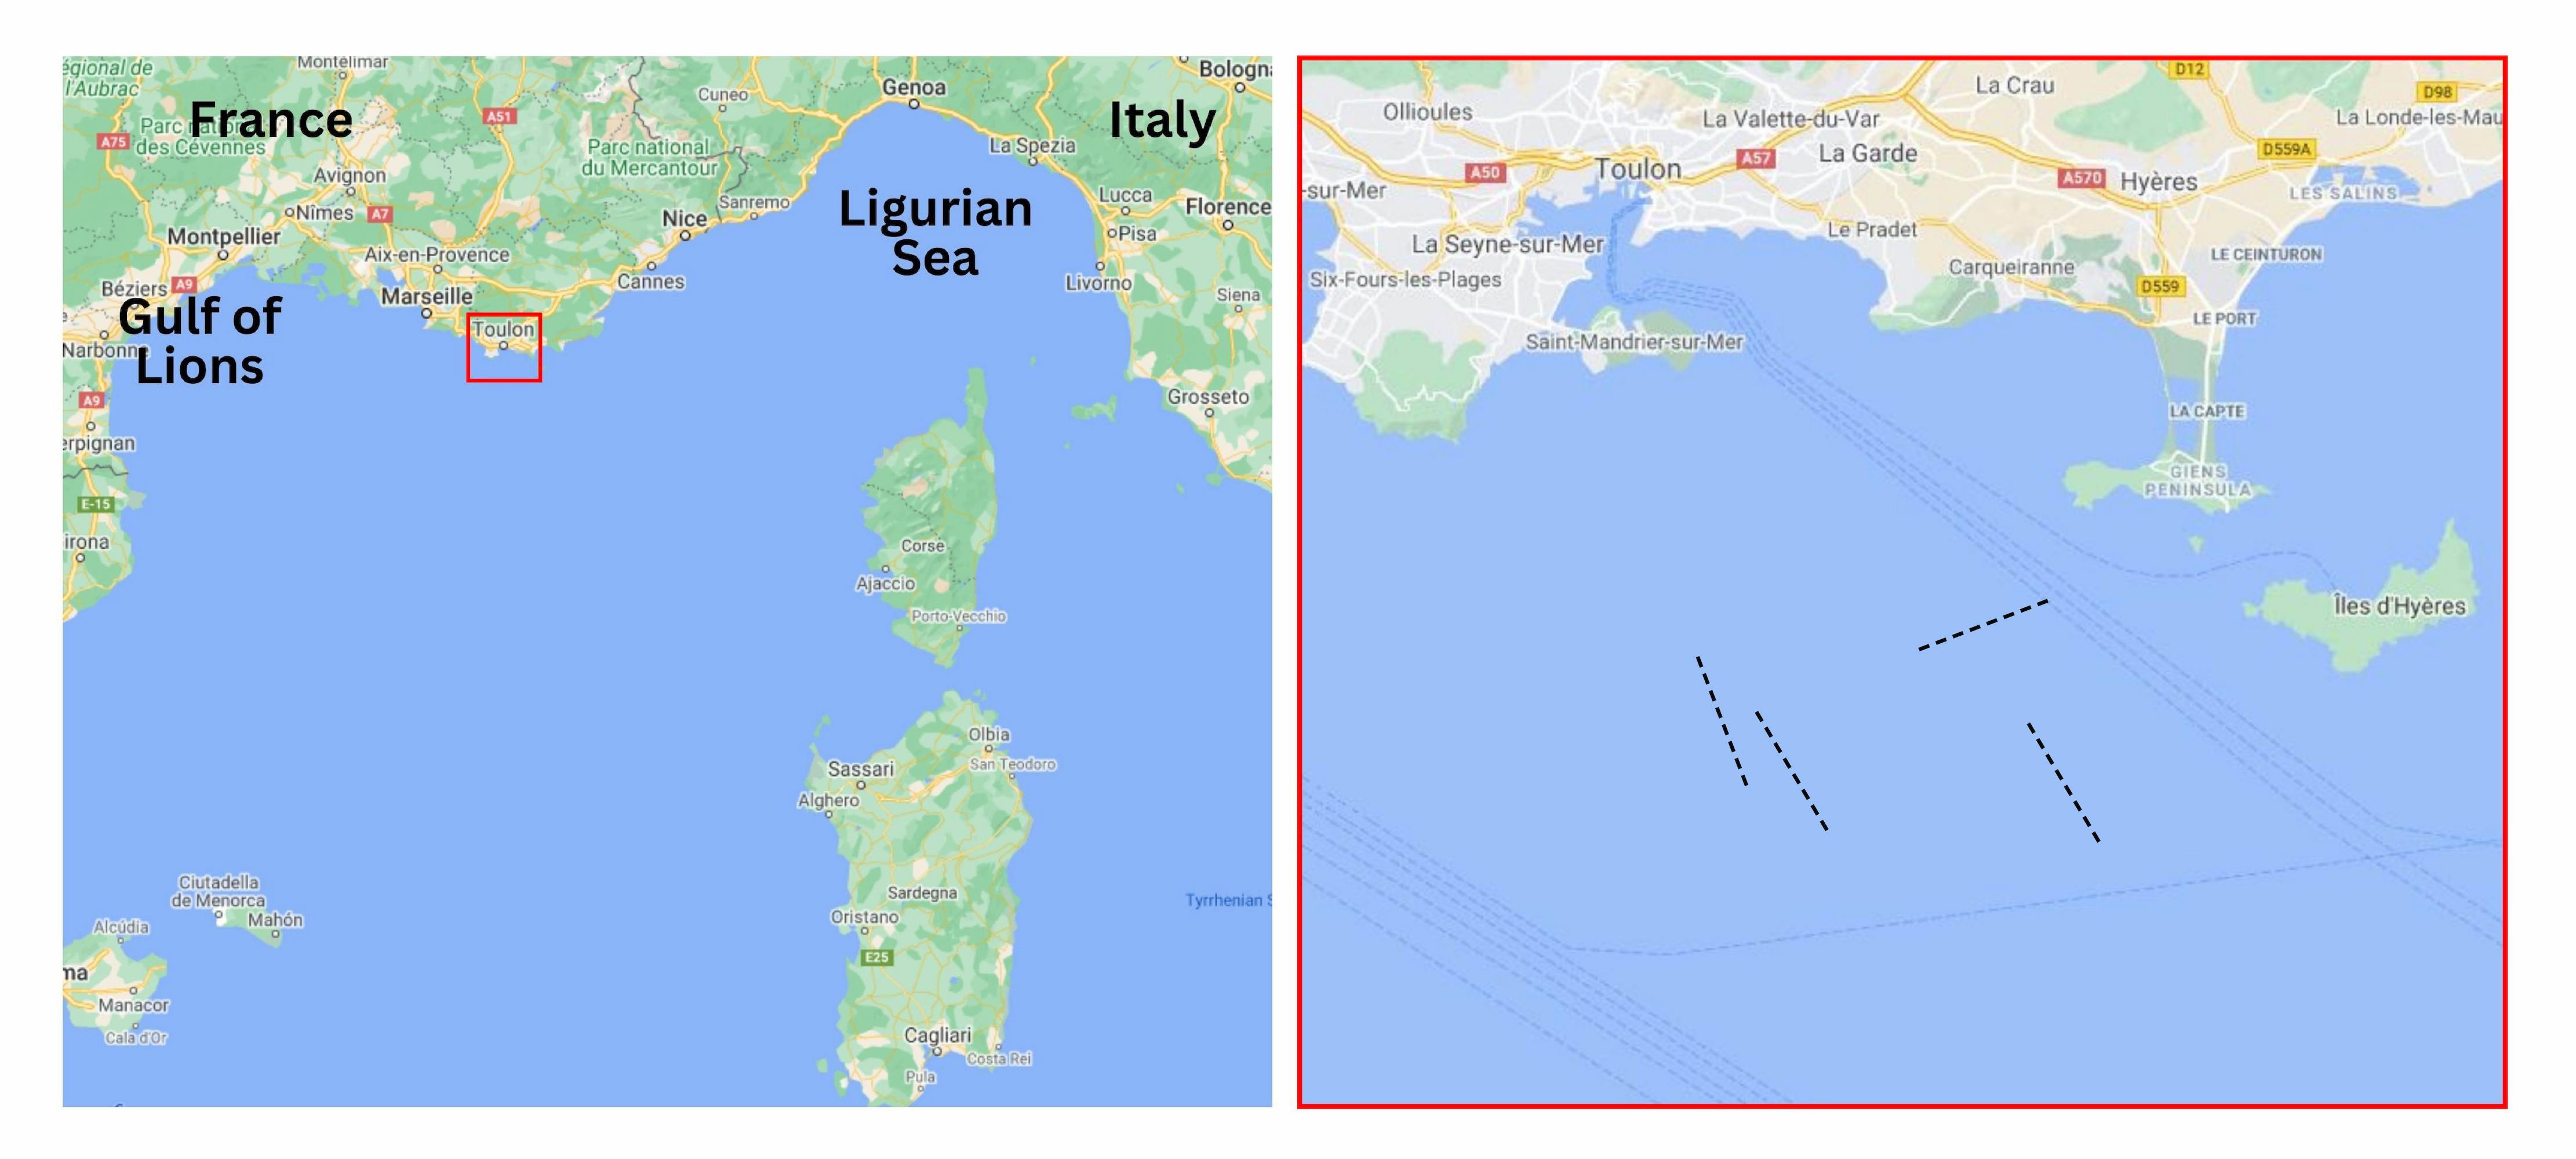
Nortek sampled the warm, salty waters over the continental shelf and slope in the Western Mediterranean Basin off the coast of Toulon, France (Figure 1) in depths ranging from 150 to 450 m. Water temperature at the sea surface in the region ranged from approximately 20.0 to 21.5 °C, and sea surface salinity was approximately 28 (Alvarez-Berastegui et al., 2020).
Three dedicated echosounder channels operating on a fifth vertical beam can be configured by users to allow for testing and optimization of settings to suit the local environmental conditions.
Current profiling in a changeable ocean environment
Upwelling events in the Gulf of Lions are forced by the north and northwesterly mistral and tramontane winds (Millot, 1979). On the morning of 24 August, wind conditions were Beaufort 2, with estimated wind waves and swell at less than ~0.3 m. By the end of the day, Beaufort 5 seaward winds prevailed, with significant wave heights of ~0.5 m. On 25 August, wind conditions were Beaufort 2 with wind waves less than ~0.2 m and swell less than ~0.1 m. Such variable environmental conditions are the norm for this region – presenting unique operational challenges for those working offshore.
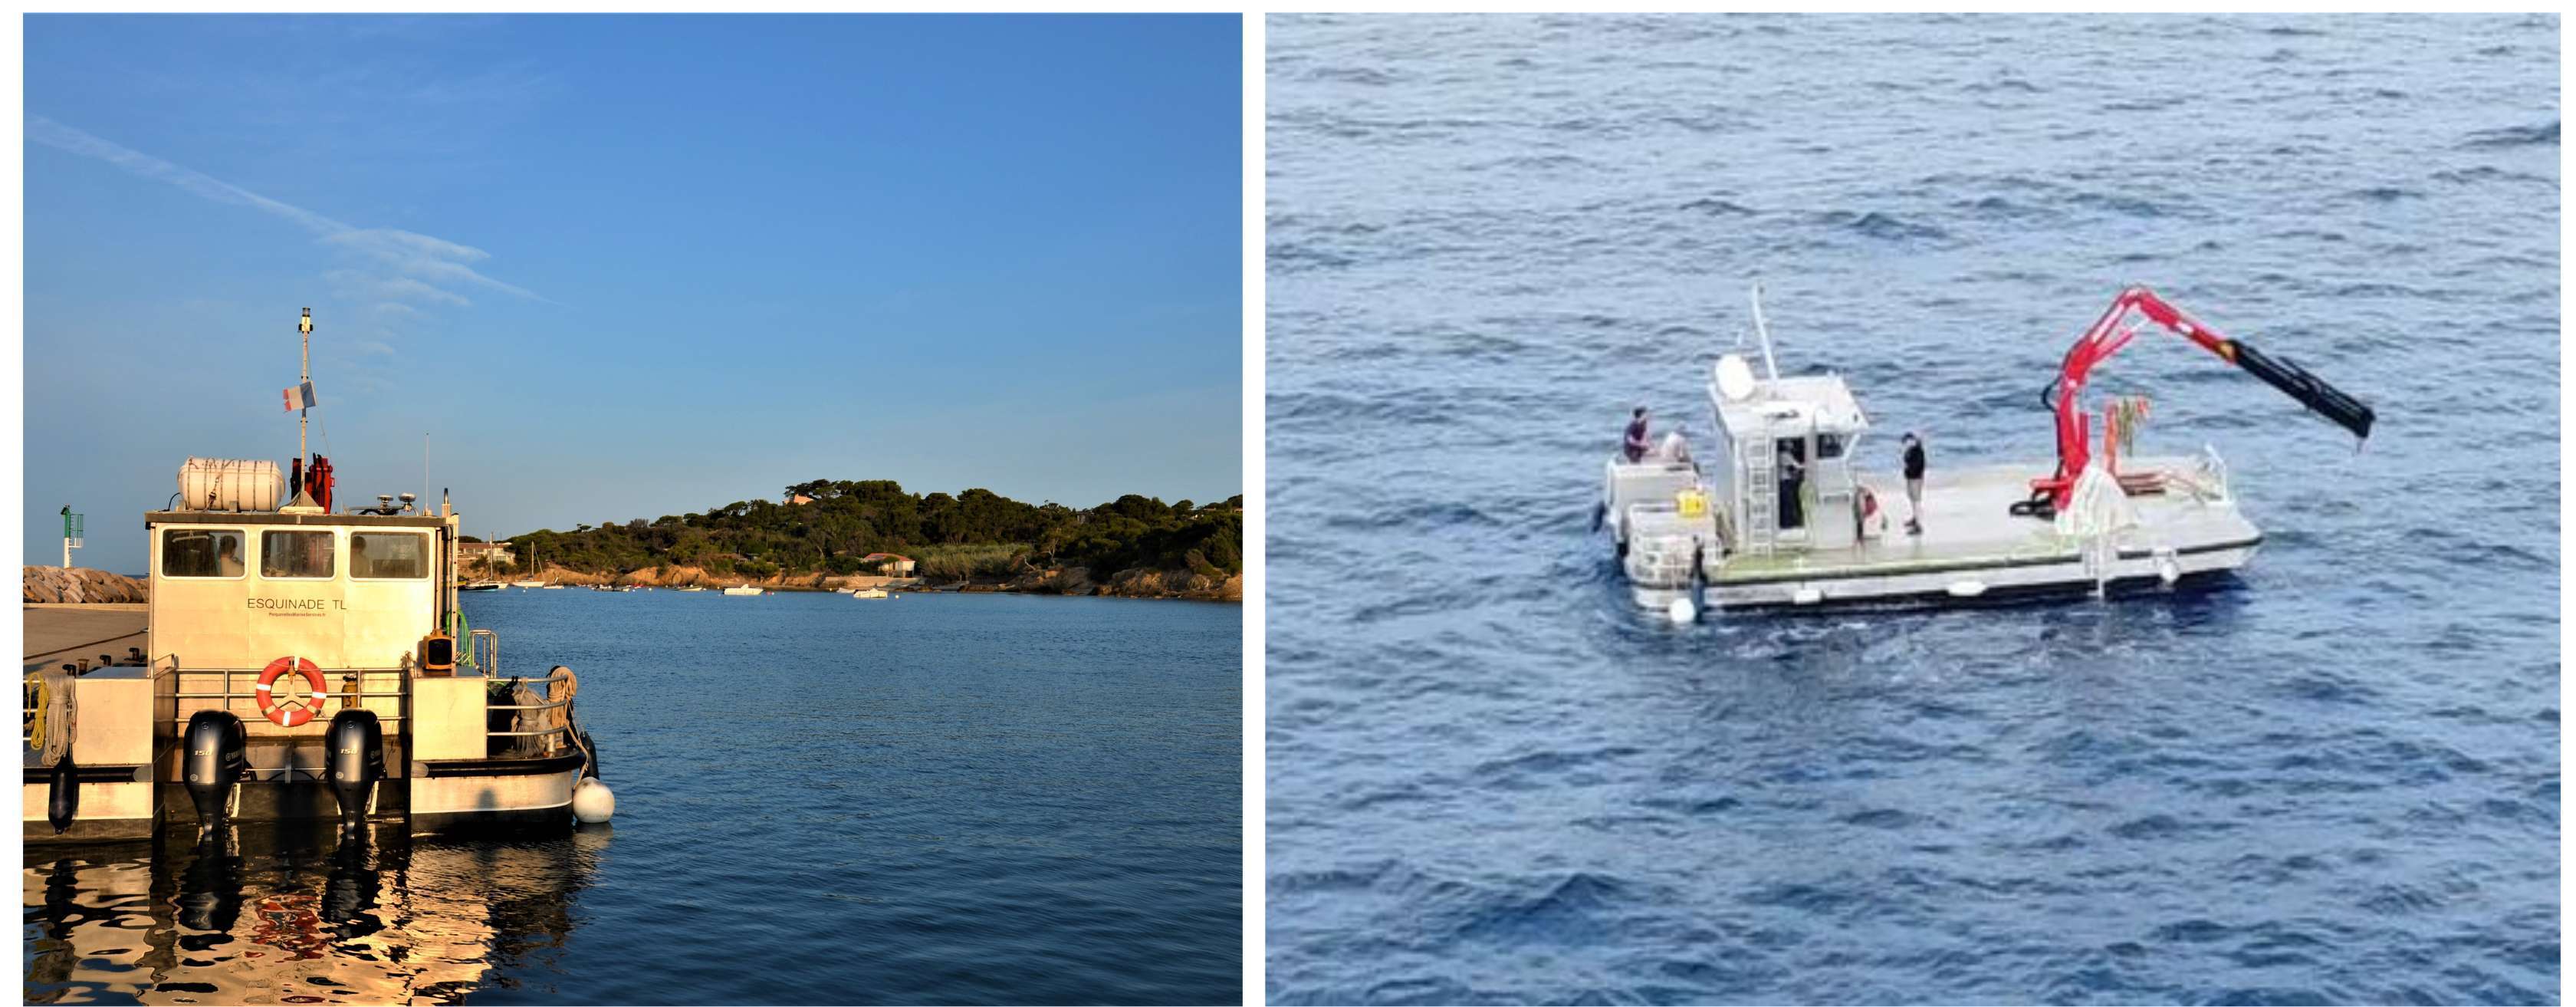
Deploying multiple ADCPs for current profiling and echosounding measurements
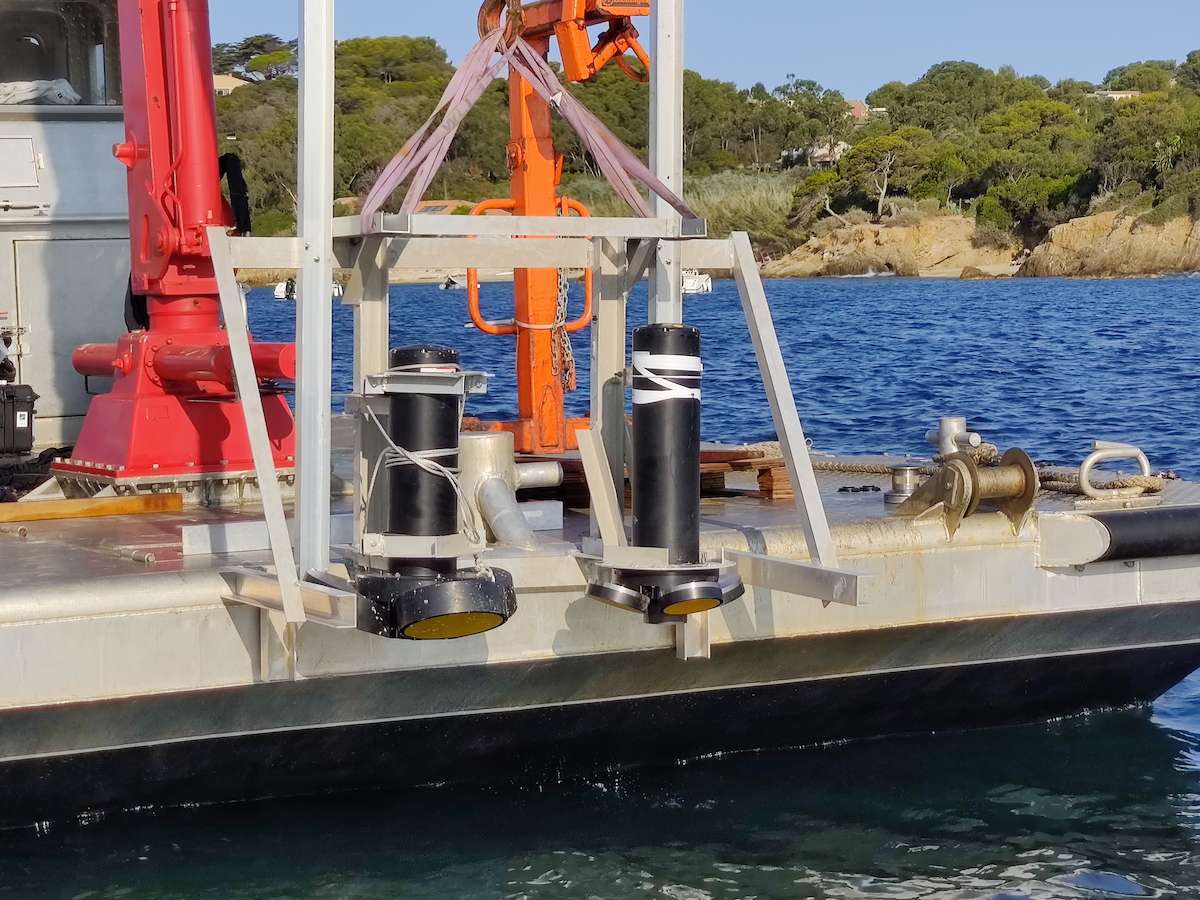
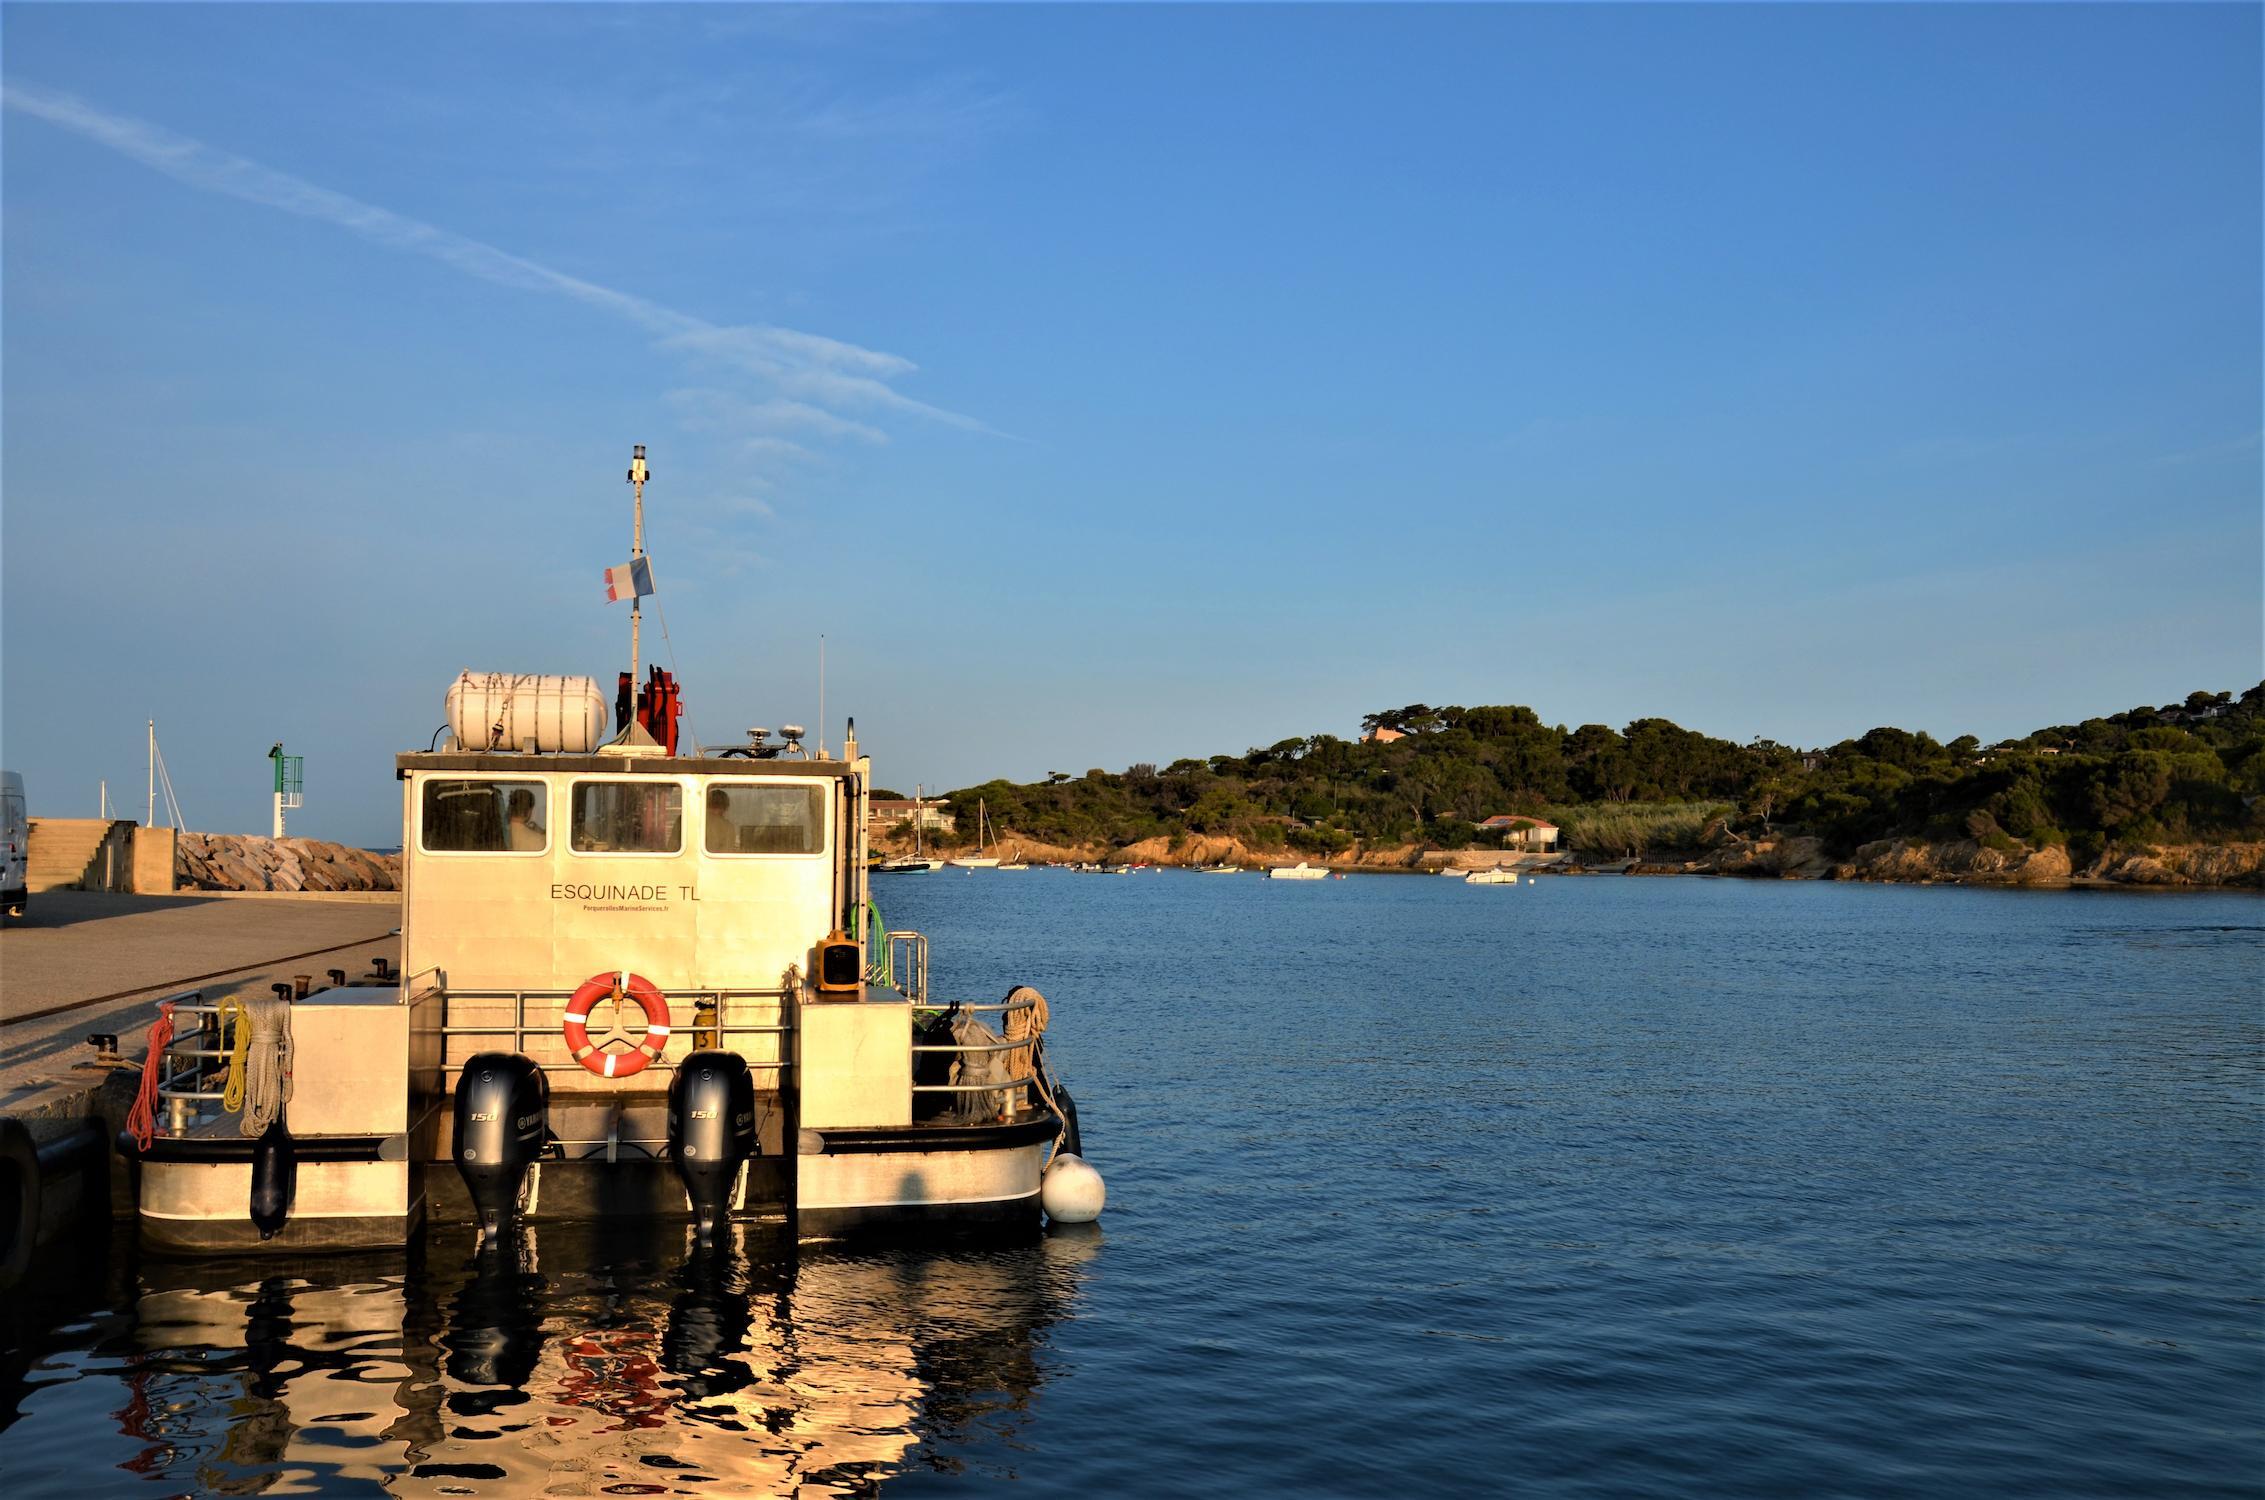
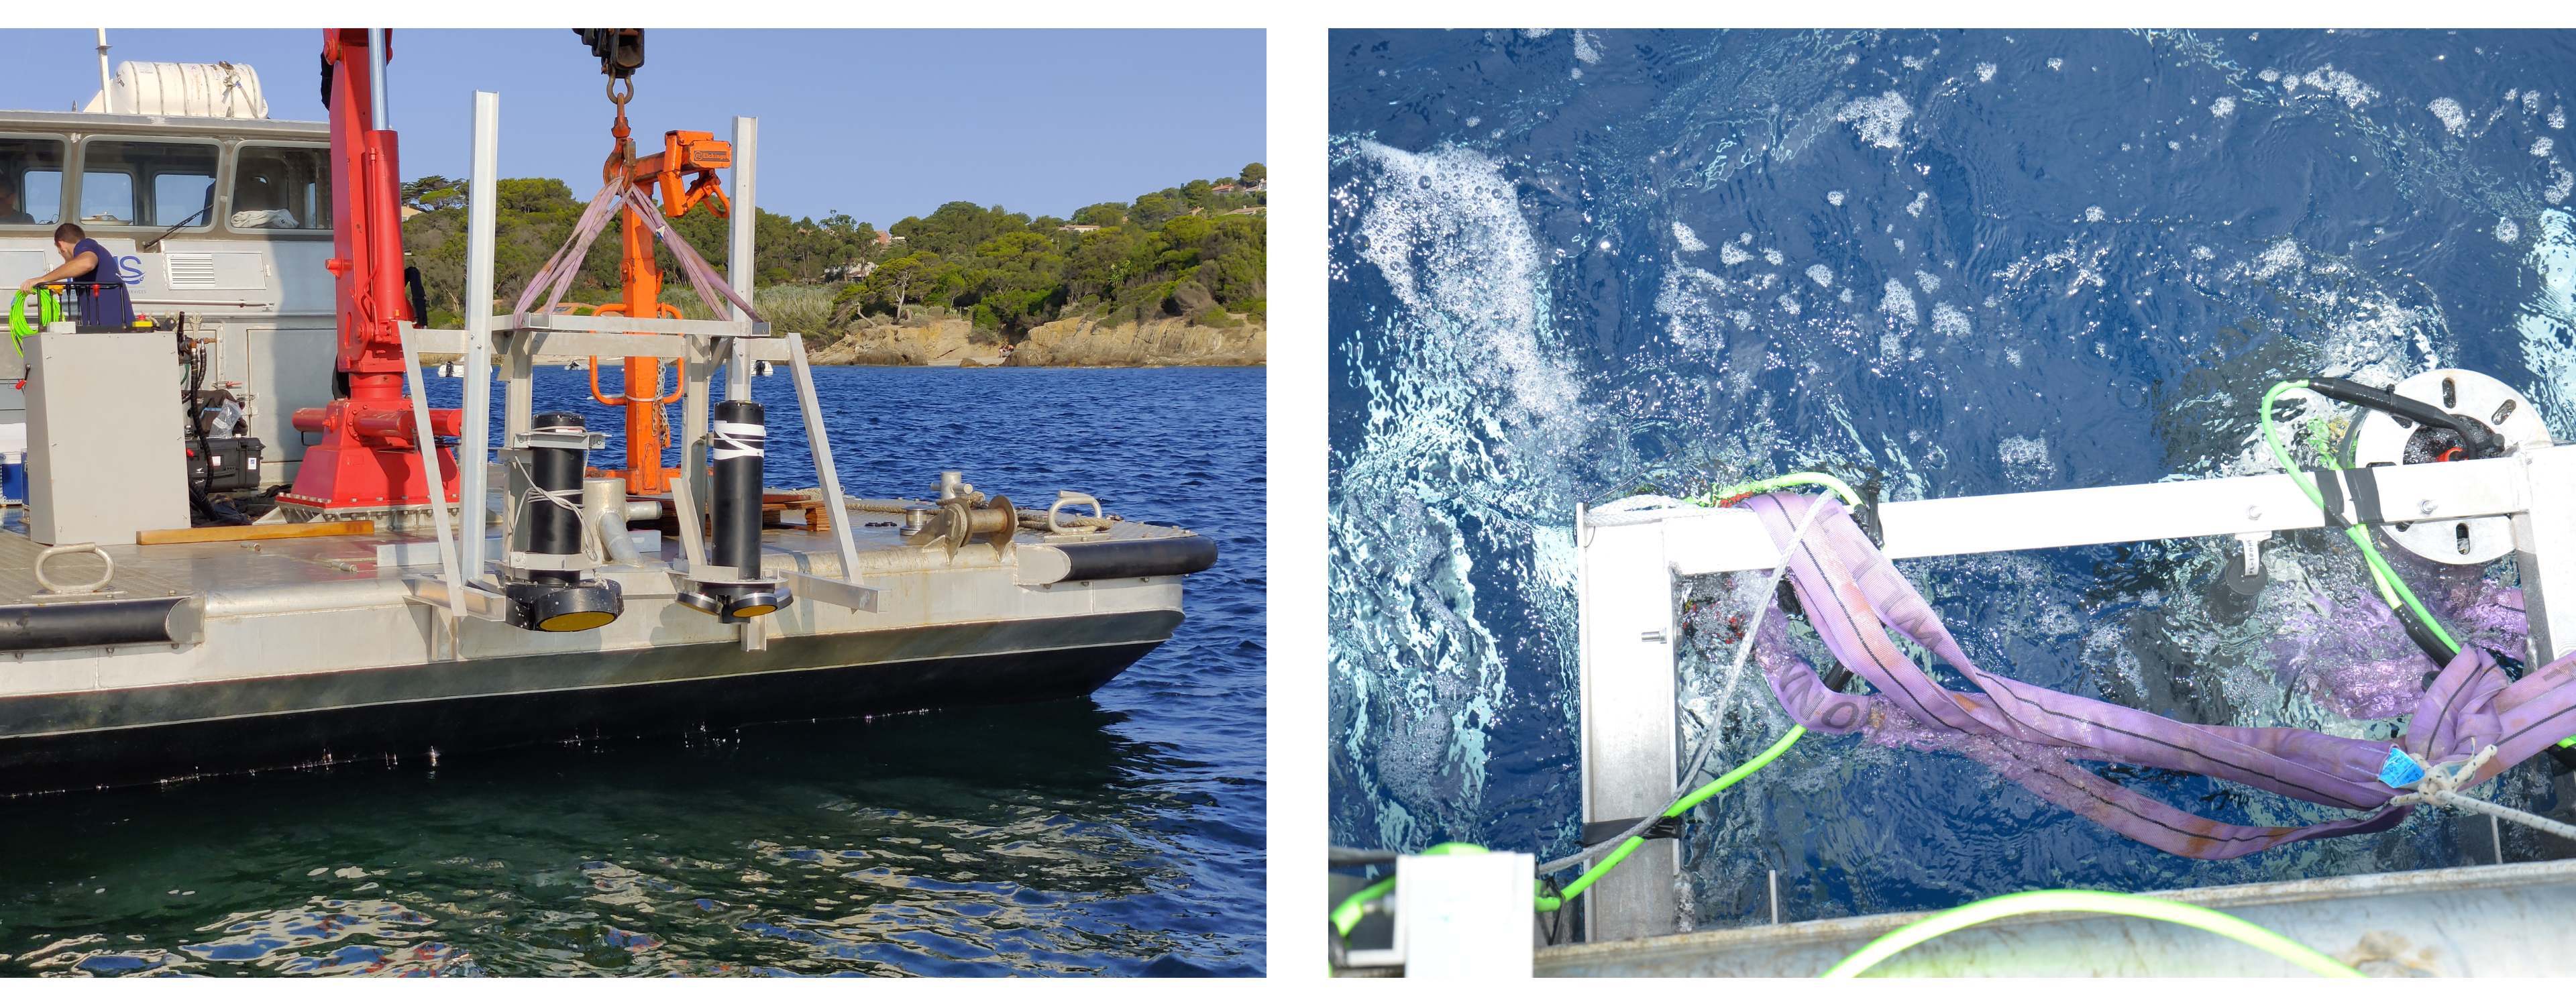
A barge vessel (Figure 2) was used to deploy Nortek’s Signature acoustic Doppler current profilers (ADCPs). A Signature 100 and a Signature 55 ADCP were mounted to an aluminum frame on the bow (Figure 3) and lifted by a crane to eliminate drag during transport.
Current profiling and echosounding measurements were made as the barge vessel transited across the region with a maintained sail speed of 1.6 to 2.0 m/s (3.1 to 3.9 knots). At low current speeds, the barge experienced up to seven degrees of change in pitch and roll, but the Signatures were still functional under these conditions.
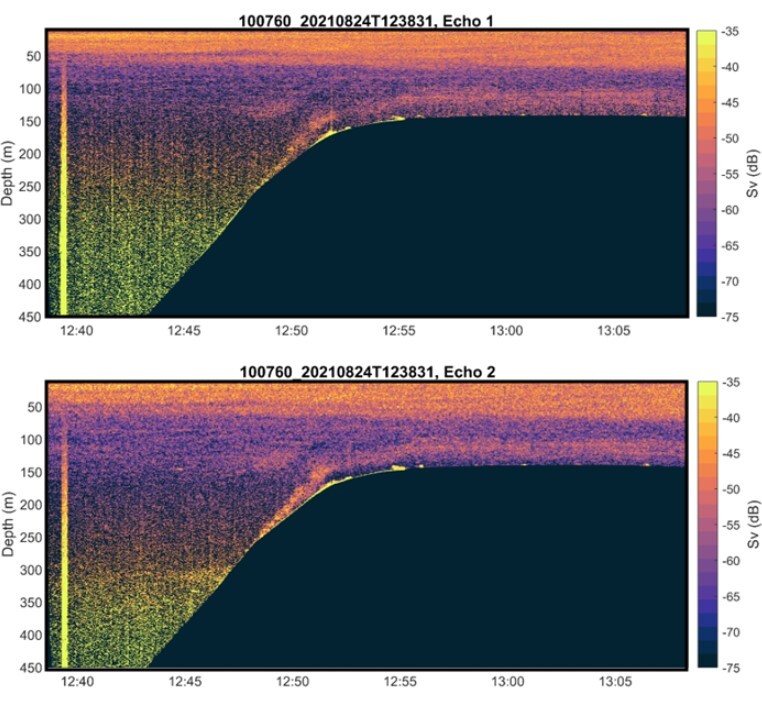
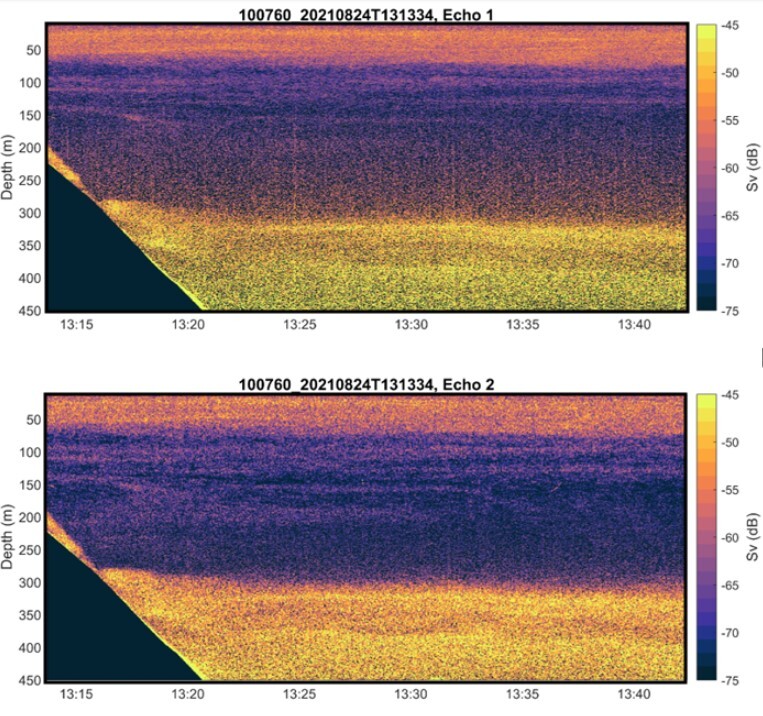
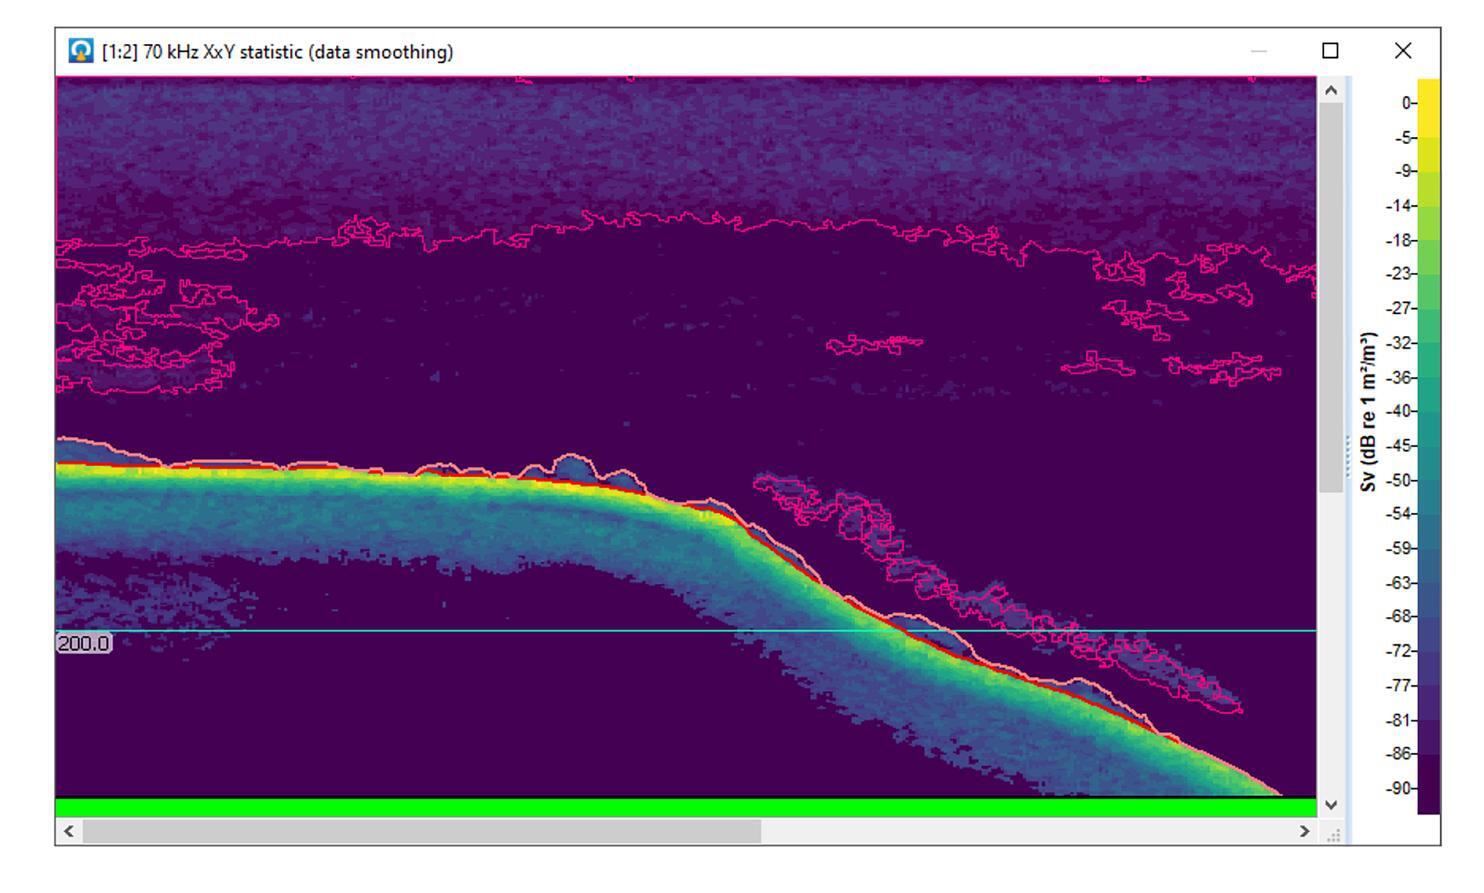
The impact of changing the echosounder transmit length is seen in Figure 4 and Figure 5. The features in the Echo 2 echogram are in sharper relief compared to Echo 1.
Optimizing the echogram of the combined current profiler and echosounder
The Signature 100 ADCP with echosounder was enabled with two frequencies (70 and 120 kHz) and a short (0.5 ms), moderate (1.0 ms), and long (3.0 ms) transmit pulse. Transmit pulse length is a trade-off between the amount of energy put into the water (long values) and the degree of acoustic resolution provided (short values). Longer pulse lengths yield a stronger return signal, while shorter pulse lengths acoustically resolve features that are closer together. Uniform cell size (0.5 m), blanking distance (10 m) and non-pulse compression were used.
Identifying physical ocean processes from echograms
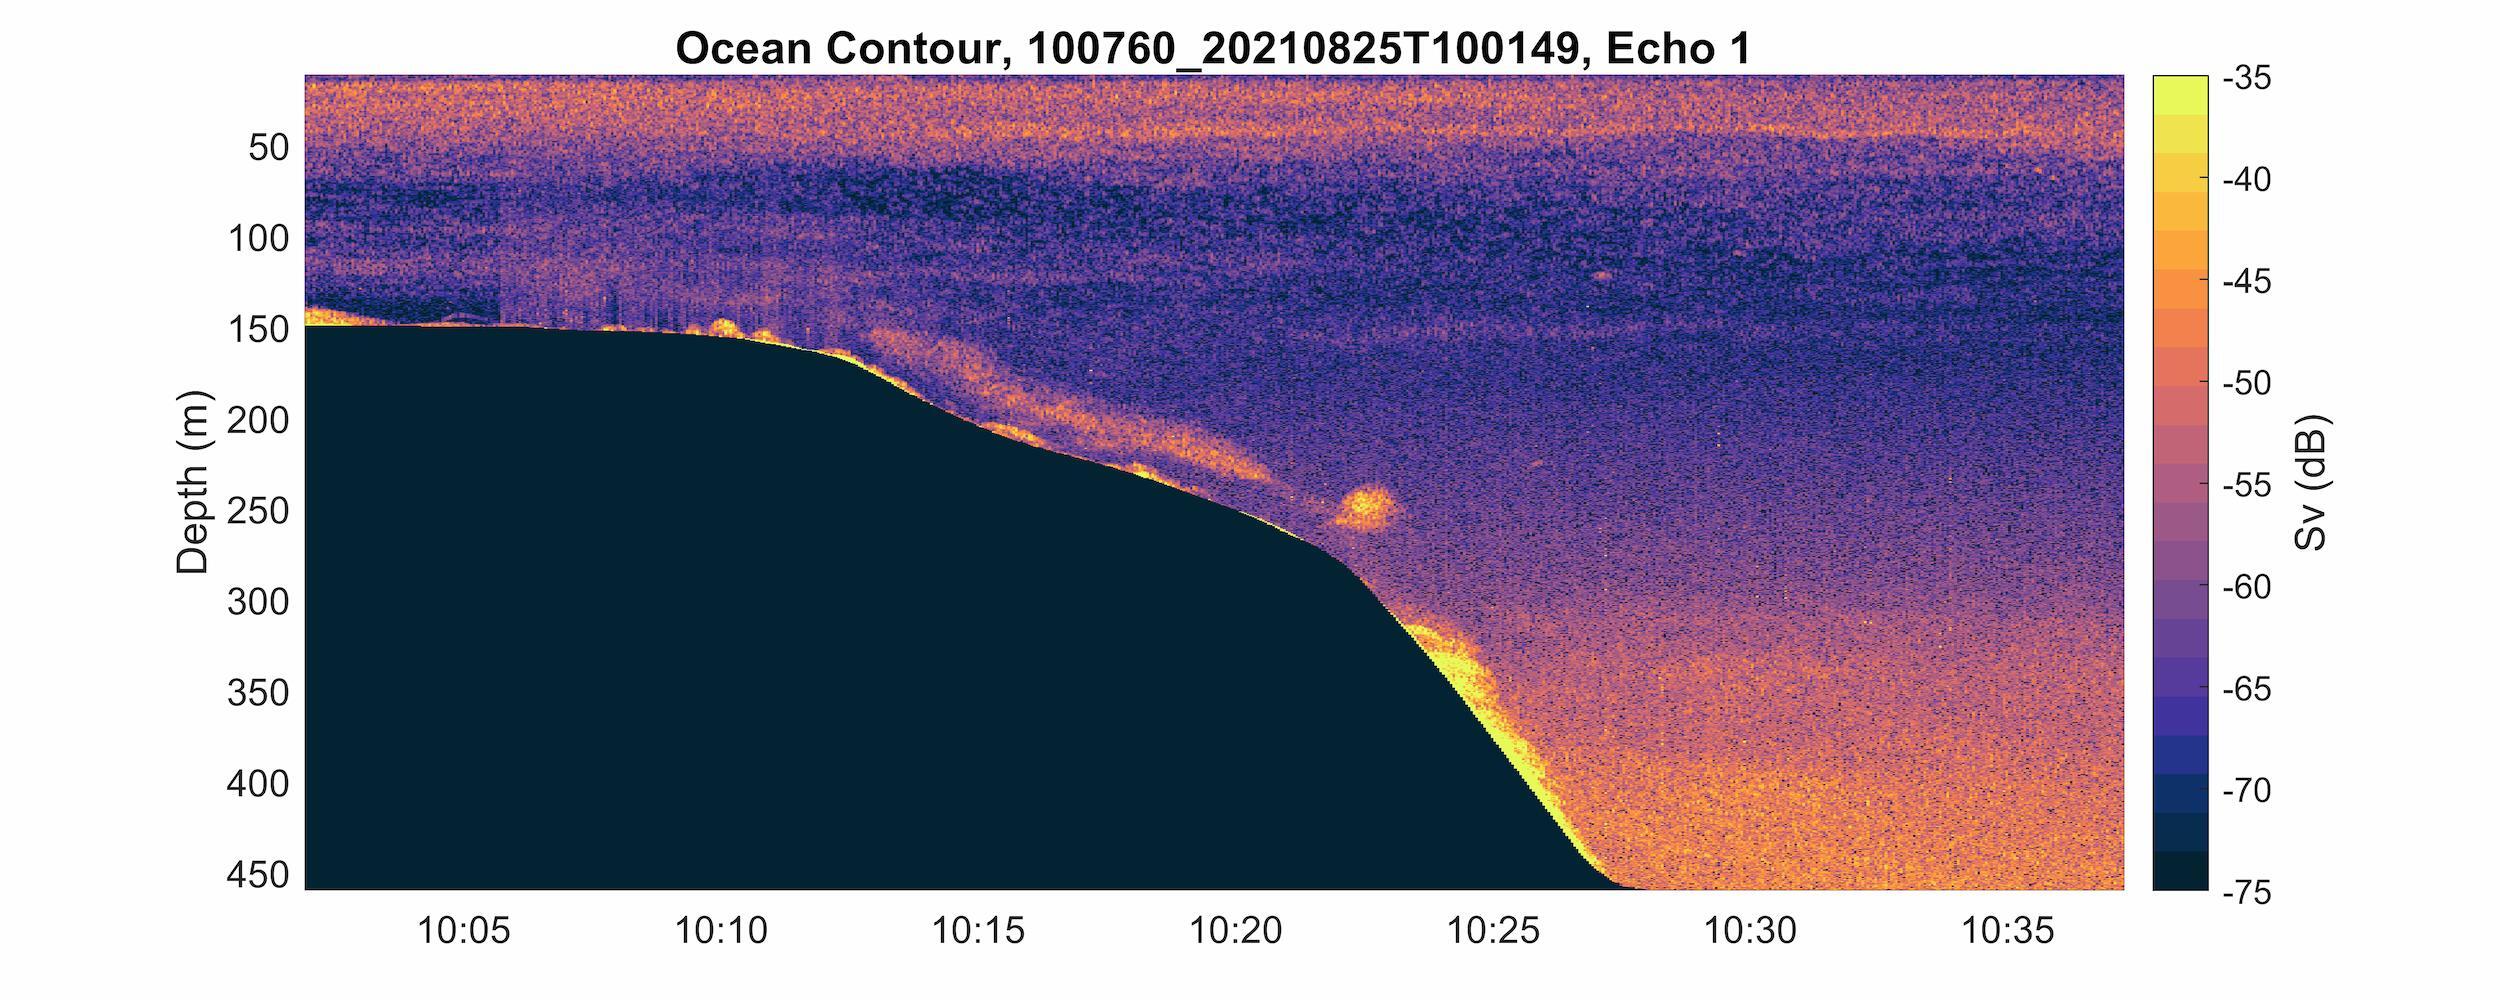
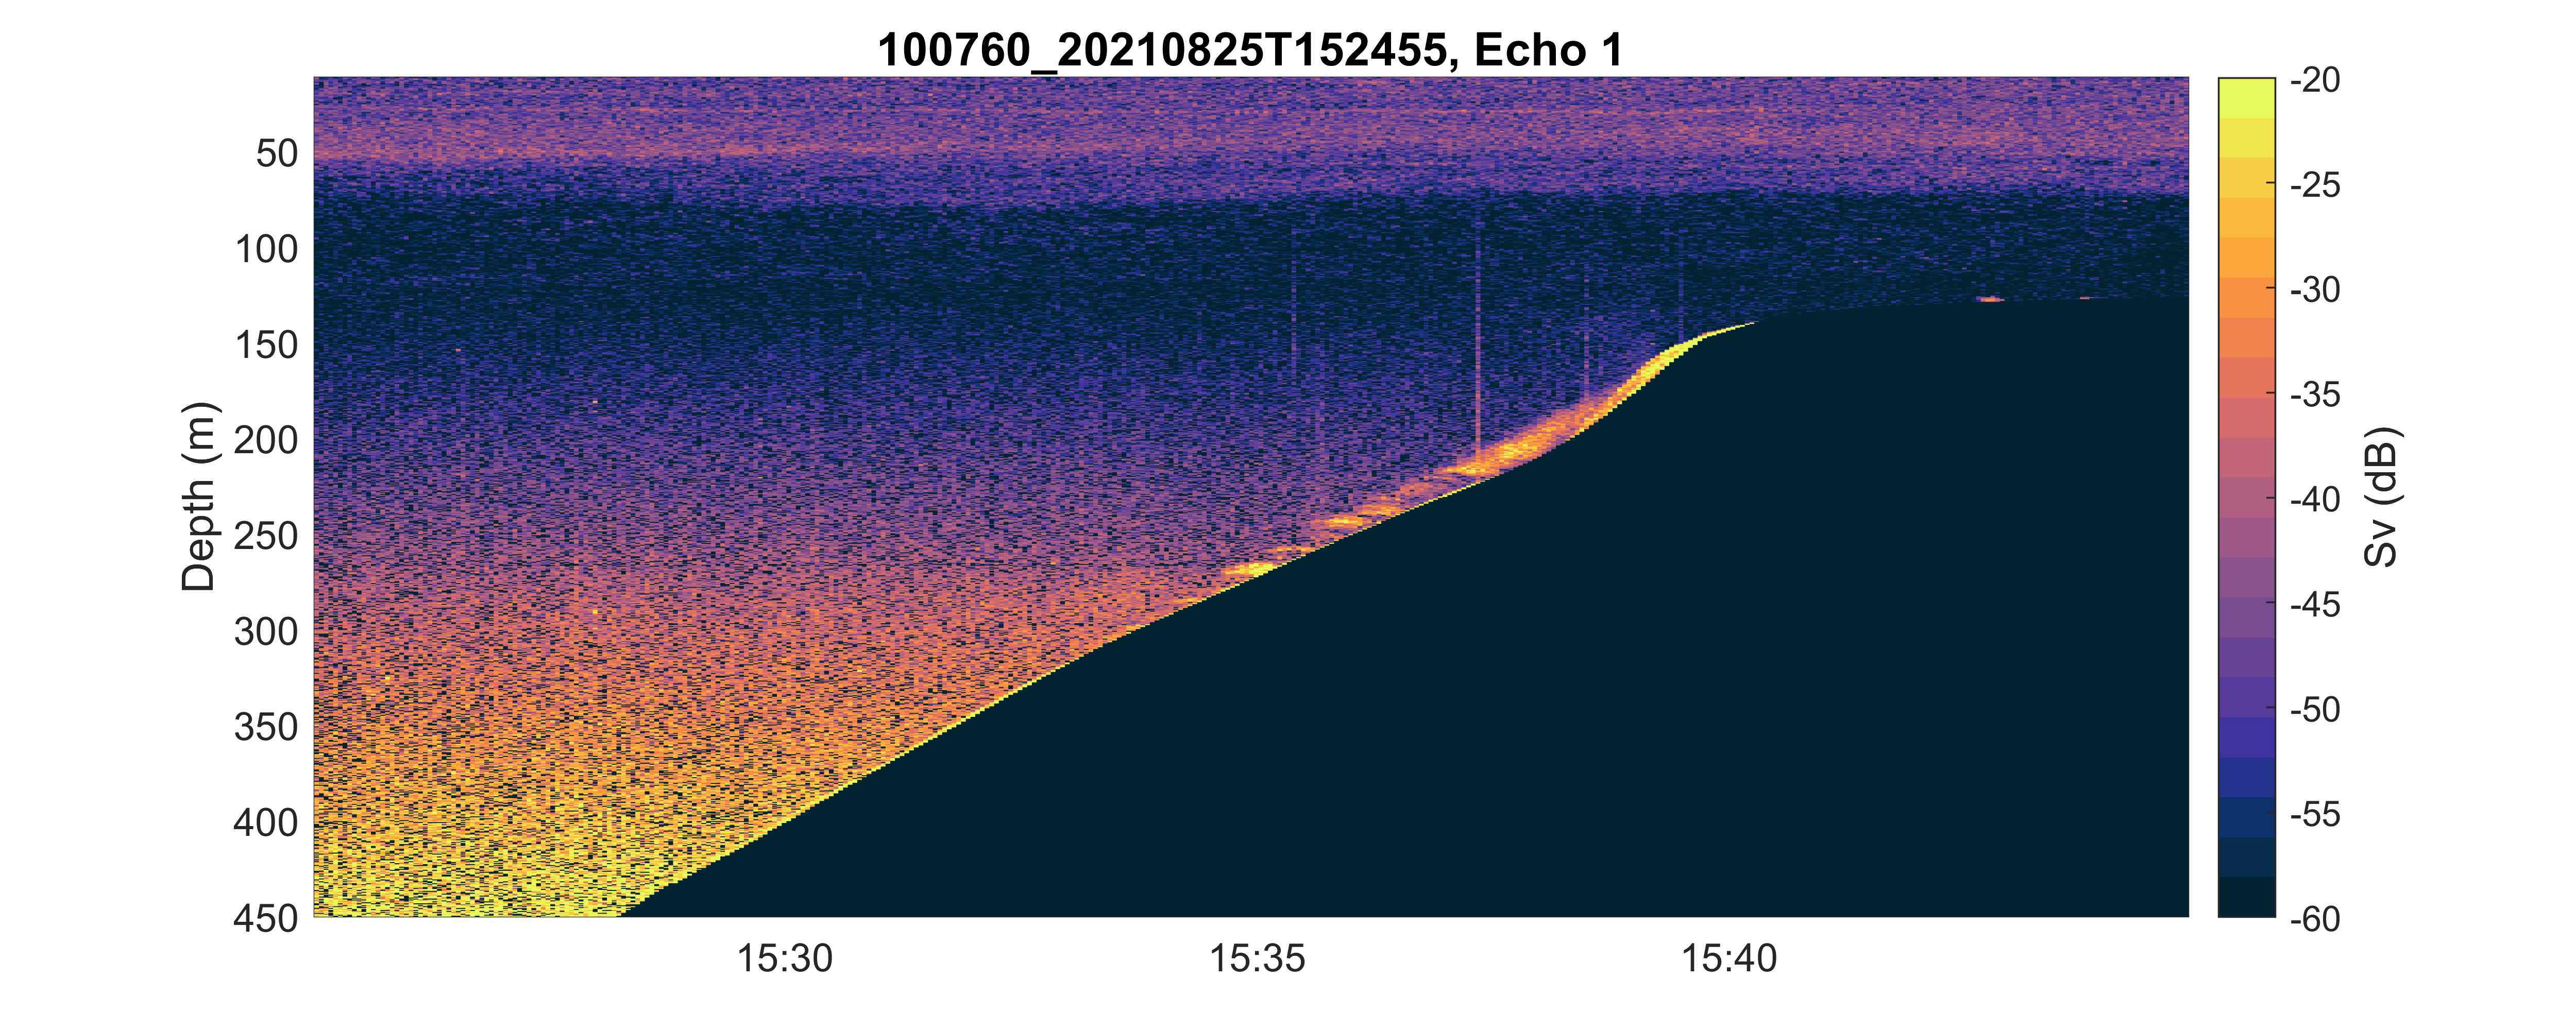
The test resulted in high-resolution echograms over the continental shelf and slope that depict stratification and water column features. Echograms of relative volume backscatter (Sv) are displayed in Figure 4 through Figure 7. Seabed delineations were extracted using maxima filtering, outlier removal, interpolated gap filling and smoothing.
The selected tracks display horizontal structures indicative of stratification – these are intensified in the upper 50–75 m where solar radiation creates strong temperature gradients. This upper layer is underlain by a lower-intensity layer extending to depths between 100 m and 150 m.
Discrete and less distinct features appear along the continental slope and shelf. In Track 1, sampled in the early afternoon of 24 August, this feature has an apparent upward velocity and bends around the slope summit into a horizontal layer at about 120 m depth. Strong northerly winds are associated with upwelling, and while surface temperatures do not indicate an event strong enough for cool waters to reach the surface, it is possible that upwelling was initiated at depth.
Combining sensor technology to provide improved environmental insights with clear visualizations
This deployment demonstrates vessel-mounted Signature 100 echosounder performance in depths of up to 450 m in low-nutrient, high-temperature, high-salinity waters. Using two echosounder channels from an ADCP with fast sampling capability and dual functionality enables measurements to be temporally and spatially identical yet provides an opportunity to resolve different features and processes that coexist. Post-processing with Echoview software enables these features and processes to be visualized clearly and effectively, which improves our understanding of our marine environment (see Figure 8).
References:
Millot, C., 1979. Wind induced upwellings in the Gulf of Lions. OCEANOLOGICA ACTA 2, 14.