Using ADCPs for world-class wave and ice research in the Arctic
- User stories
Synopsis
Challenge
Sea ice has been melting earlier and returning later year after year. Understanding the interactions between ocean processes and sea ice can help understand the mechanisms behind these trends.
Solution
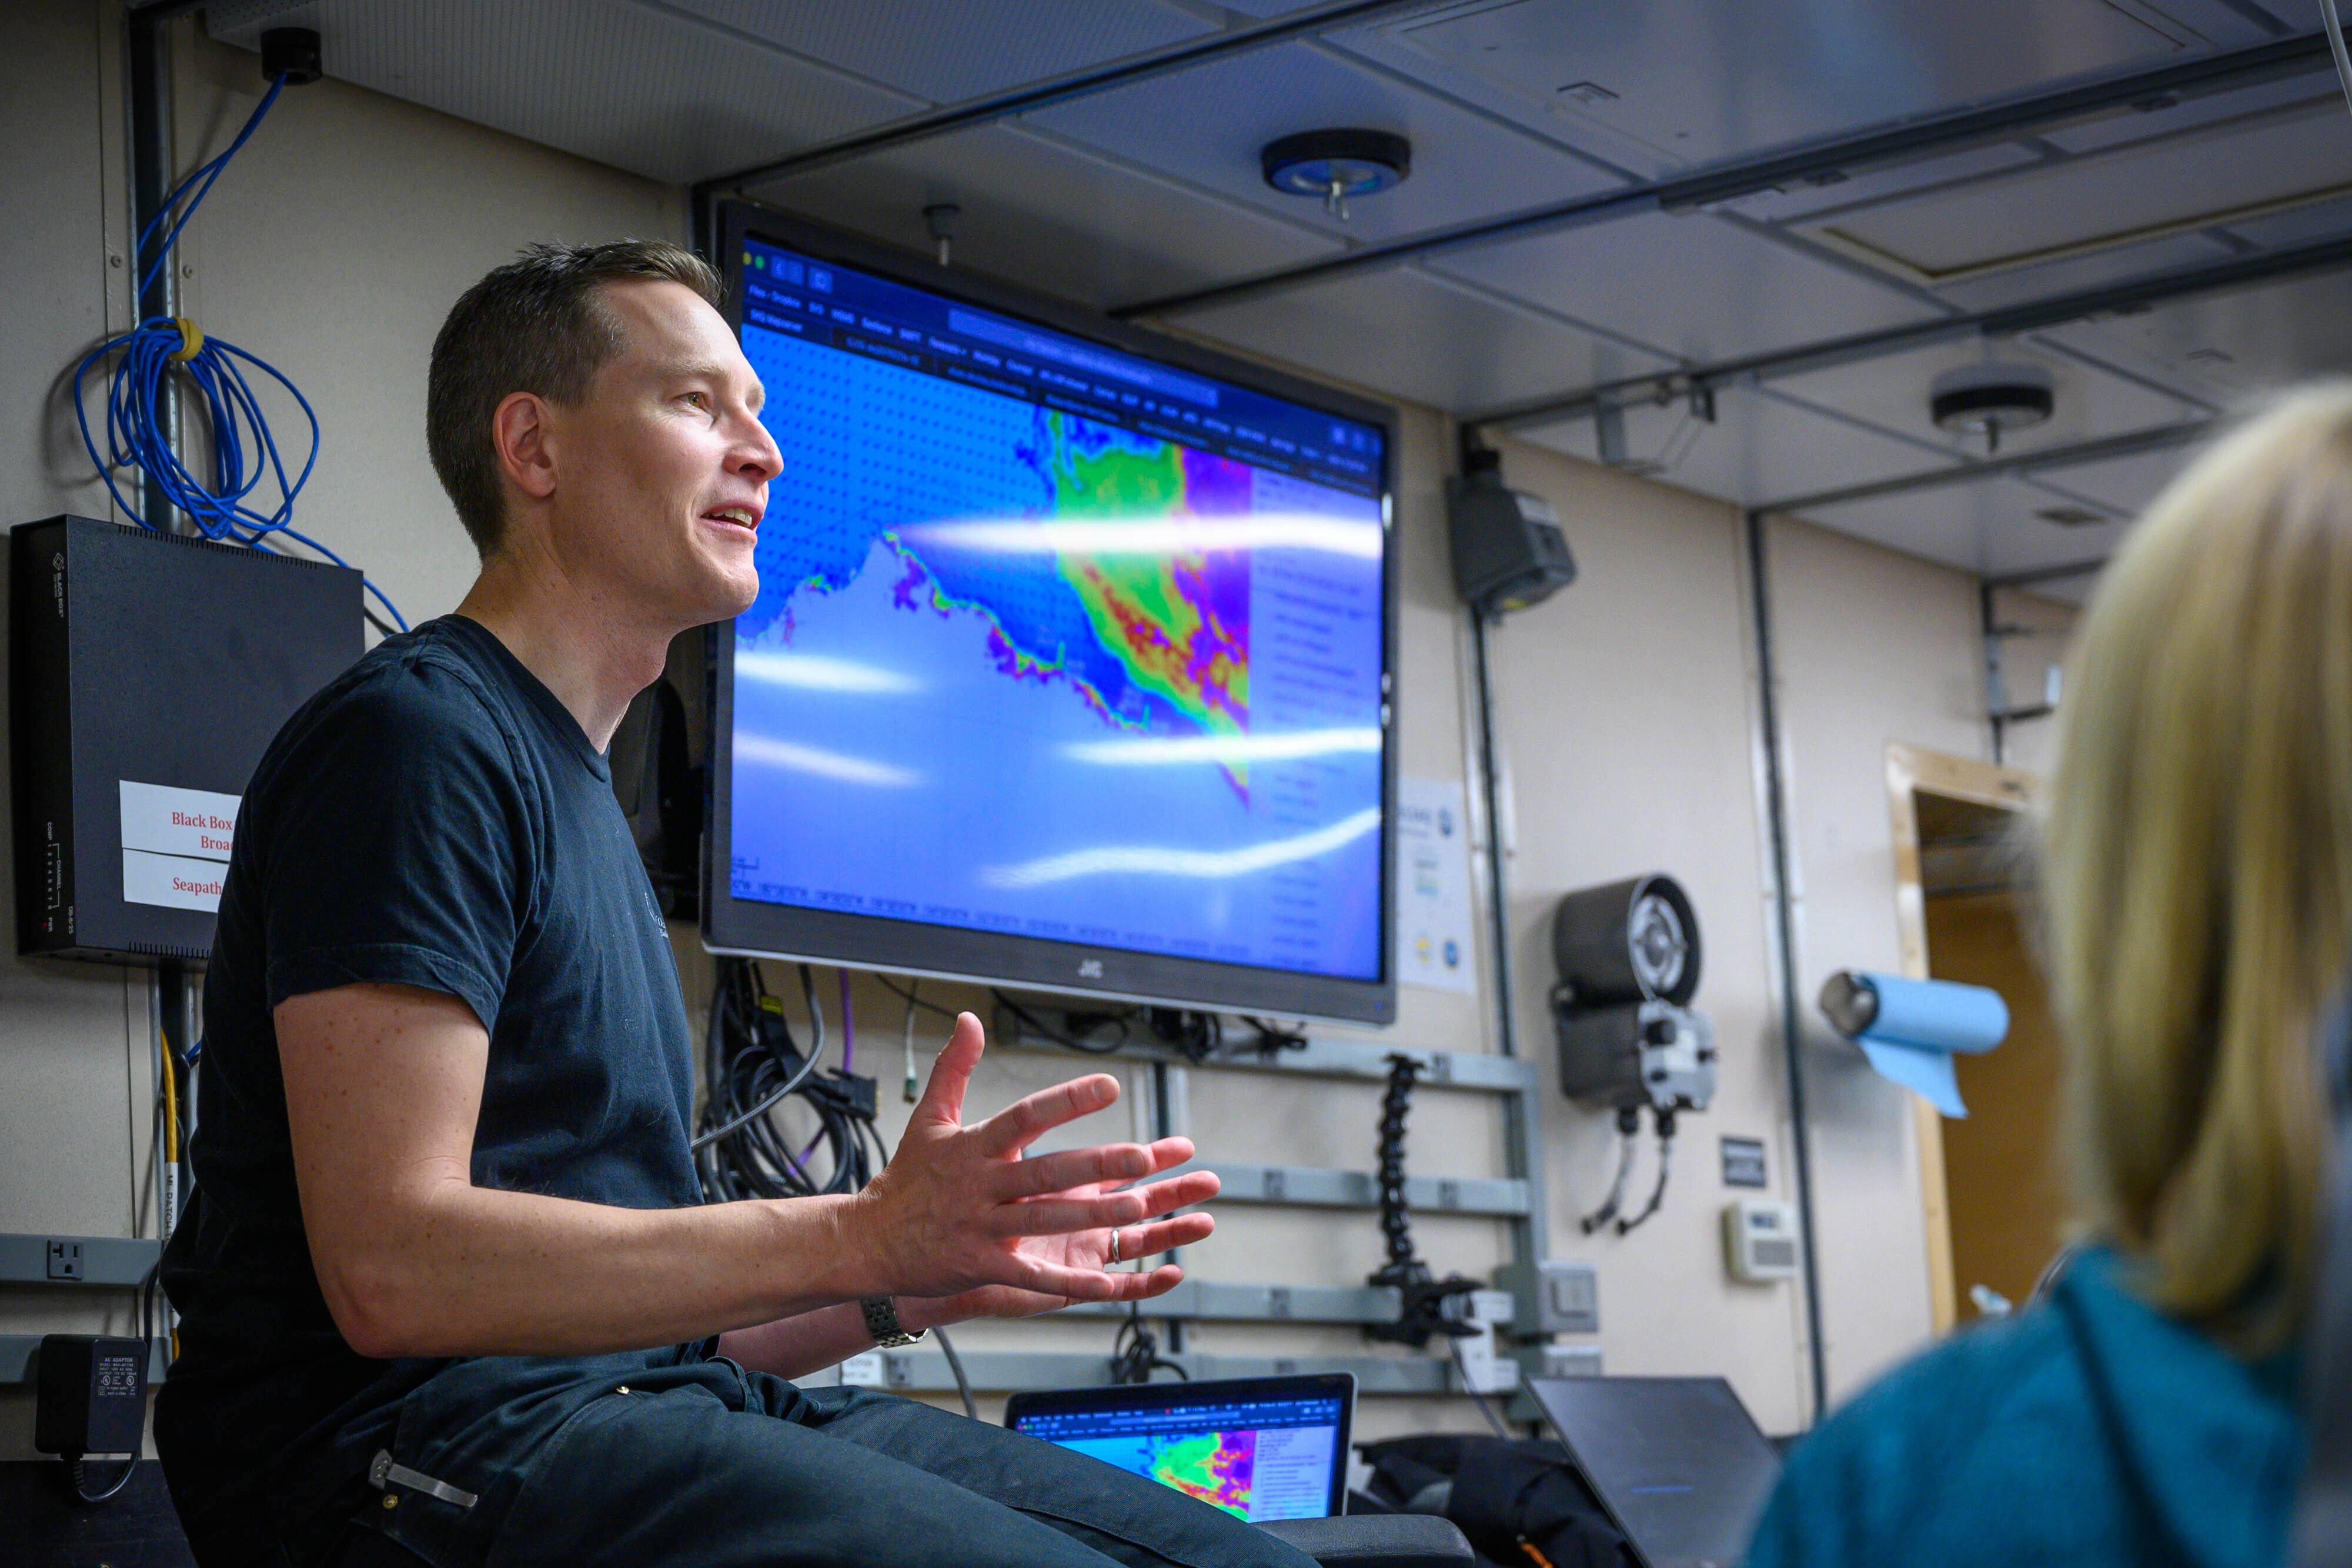
Professor Jim Thomson and a team at the University of Washington Applied Physics Lab used a suite of Nortek instruments to explain how turbulence and waves in the Arctic can influence sea ice melting.
Benefit
Uncovering these processes is essential for conserving and protecting sensitive areas like the Arctic from the effects of climate change.
In the Arctic, the end-of-summer sea ice extent in 2020 was the second-lowest in the last 42 years.
“The ice used to melt out in June or July. Now it melts out in May. It used to come back in September or October. Now the ice comes back in November or December,” says Professor Jim Thomson, Senior Principal Oceanographer at the University of Washington’s Applied Physics Lab and a Professor in the Department of Civil & Environmental Engineering.
Research necessary as melting ice exposes coastlines to harsh waves and erosion
The implications of the Arctic’s changing sea ice are many. On a global scale, sea ice influences global climate. Within the region, activities such as commercial shipping and naval operations may find life easier with the decline. For local communities, however, the loss of sea ice means the loss of a protective barrier that shelters their homes from harsh waves driven by storms that would otherwise batter and erode coastlines that are not resilient to their impacts.
In a twist, waves along the coast and further offshore may become a more prominent feature as the sea ice continues to decline.
Research on sea ice and the impact of waves
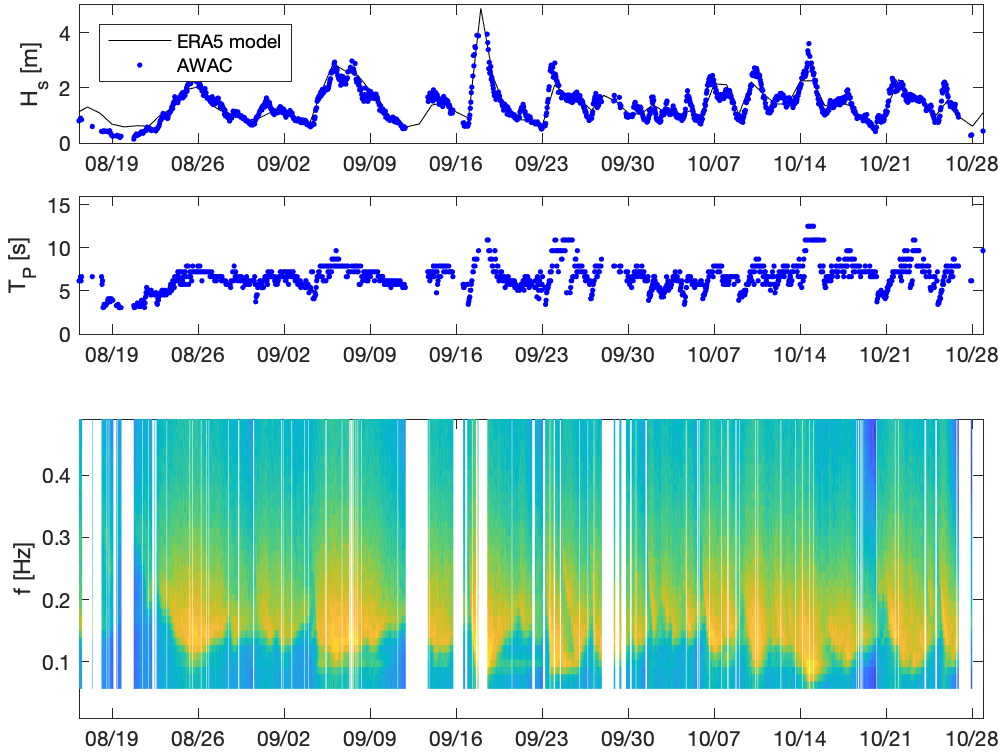
While sea ice lies on the ocean surface, there is less space for waves to form. Any waves that do so find their energy scattered and dissipated by the ice. Historically, winter waves might reach just over half a meter in height, but today they far exceed this. In September 2012 – the year with the lowest recorded end-of-summer sea ice extent – Thomson and colleagues detected waves some 5 m high with a 600 kHz acoustic wave and current profiler (AWAC)mounted on a subsurface mooring in the Beaufort Sea.
Waves can do several things that can expedite ice’s decline. First, waves can erode the ice edge. Second, they can break the ice up.
“Imagine there is a nice big flat sheet of ice, and the waves break it up into lots of bits. Once it’s broken up, it has more surface area exposed to the ocean, and if the oceans warm, the pieces of ice are more likely to melt,” Thomson explains. “There’s a potential feedback mechanism wherein you lose a little bit of ice and make some waves, and those waves eat away at the ice edge or break it up, and so you lose more ice, and then you make bigger waves, and now you’re off and running.”
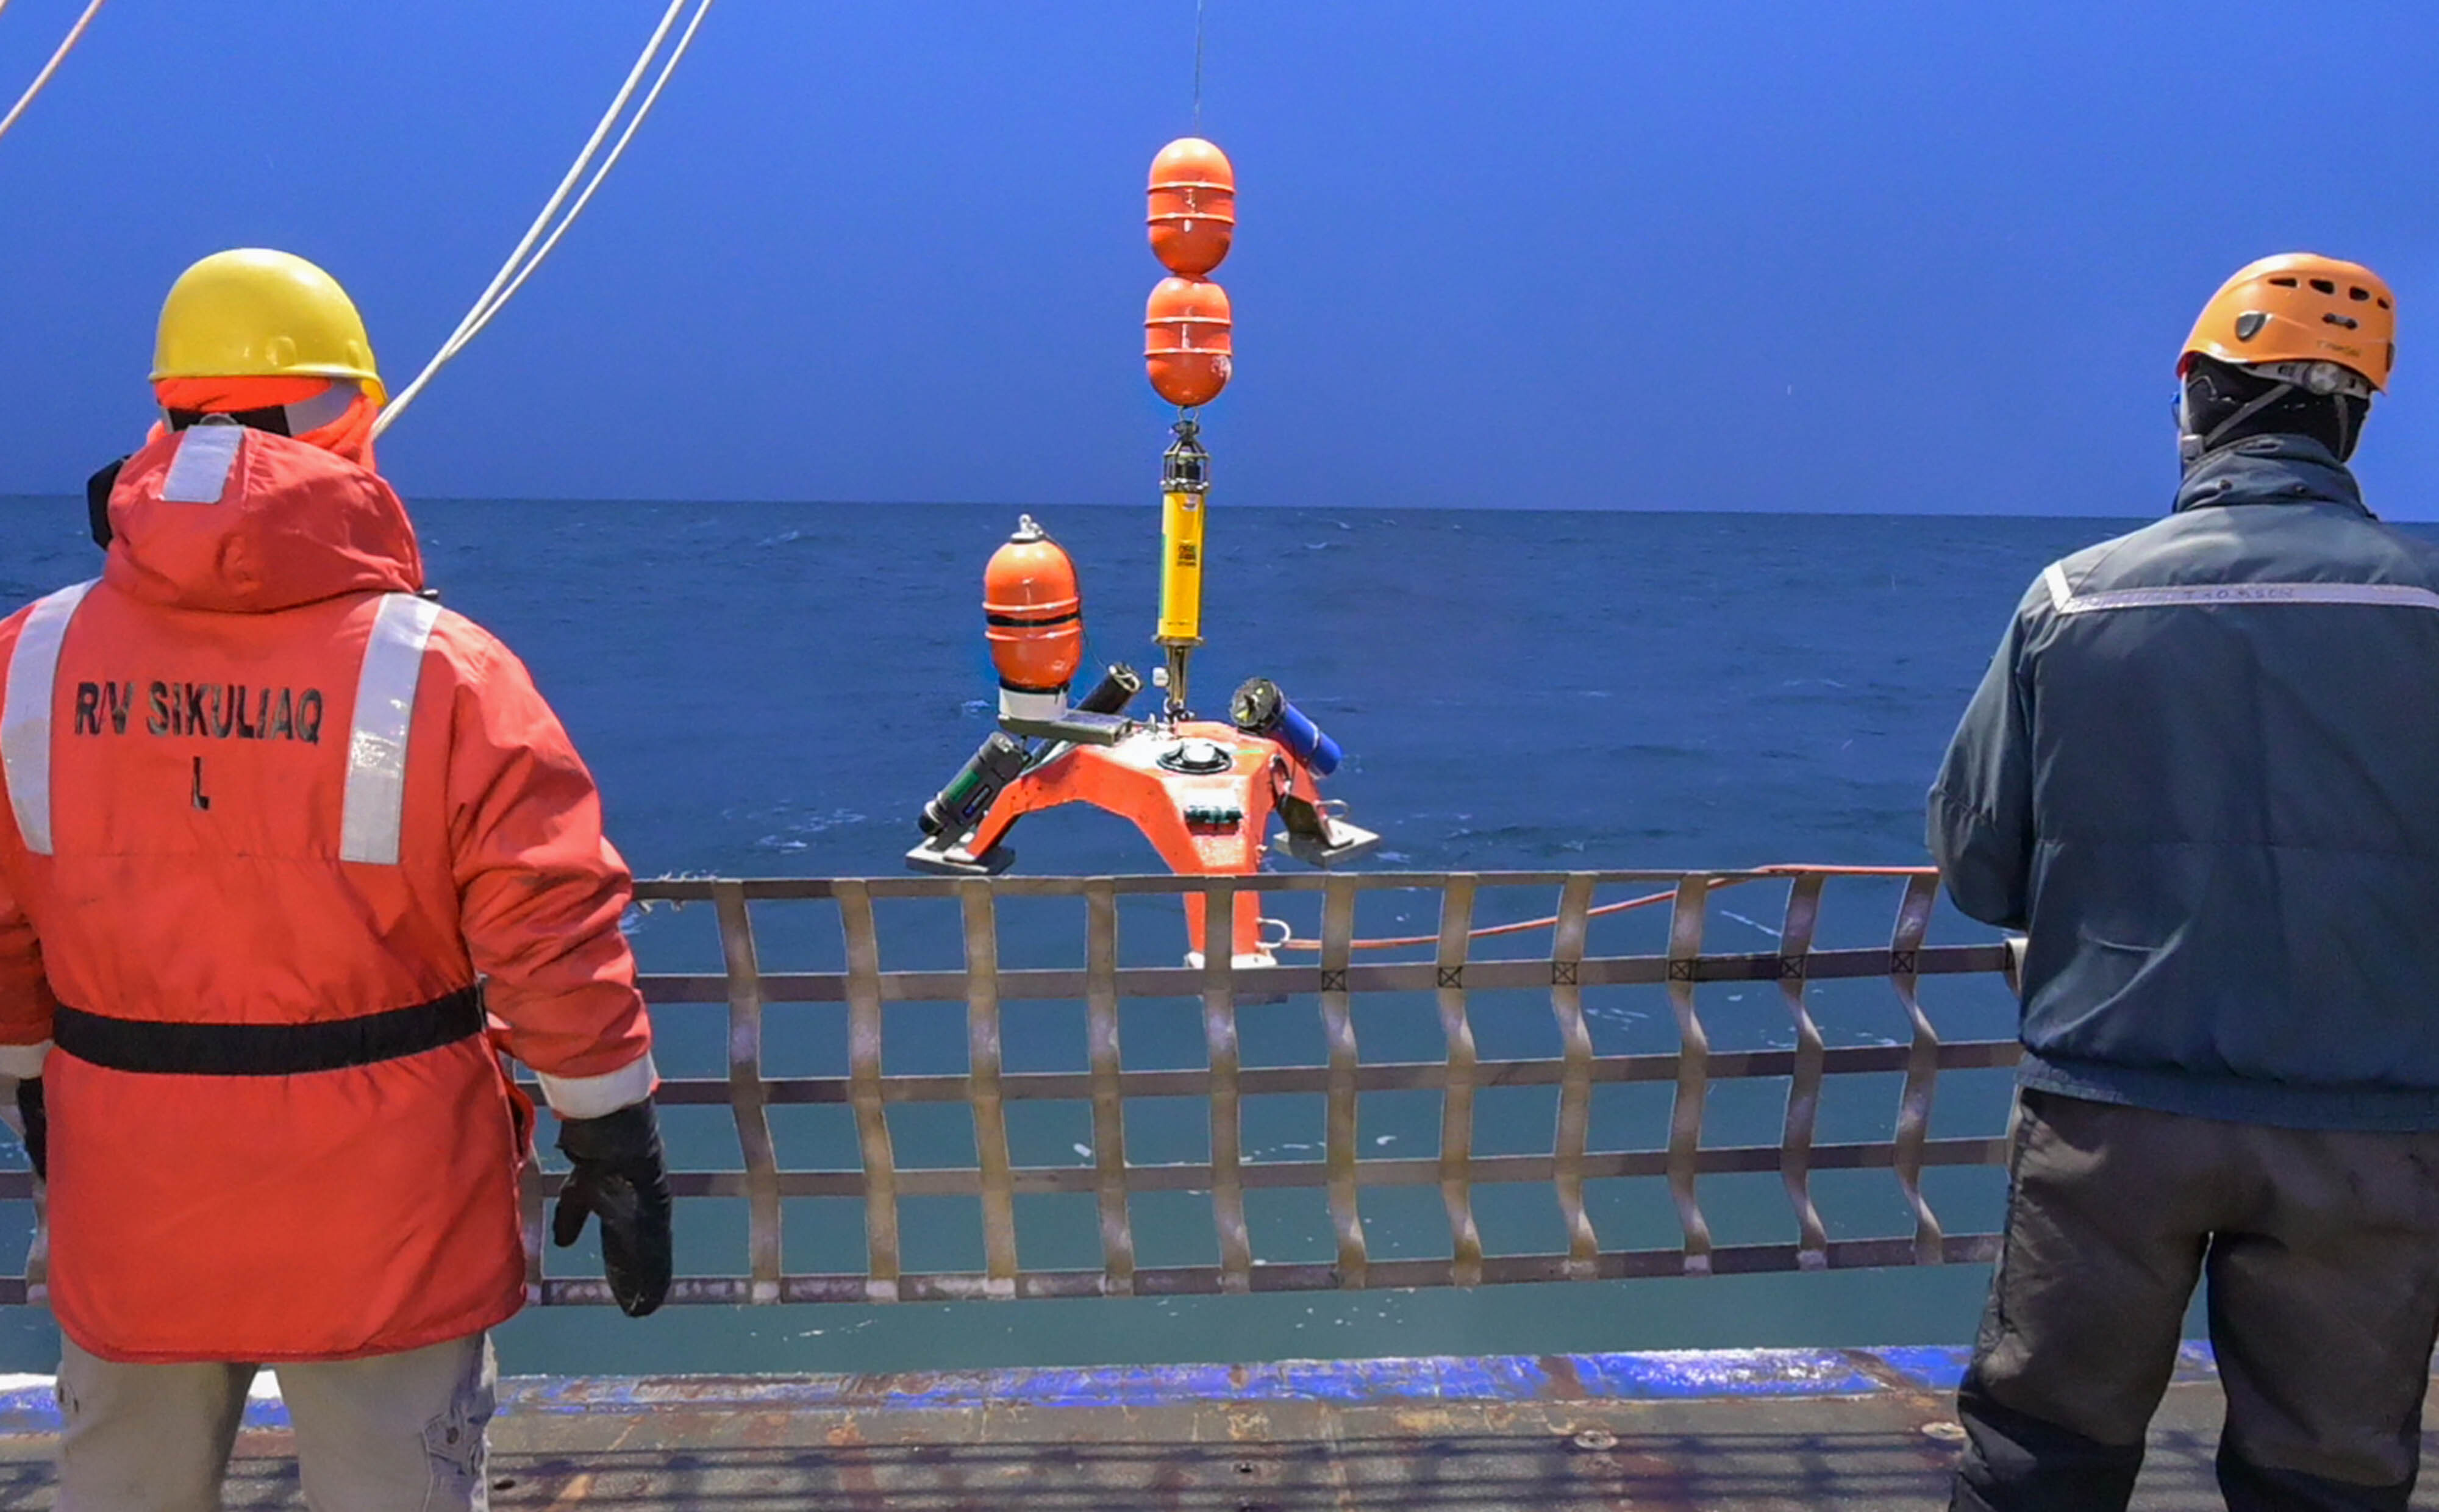
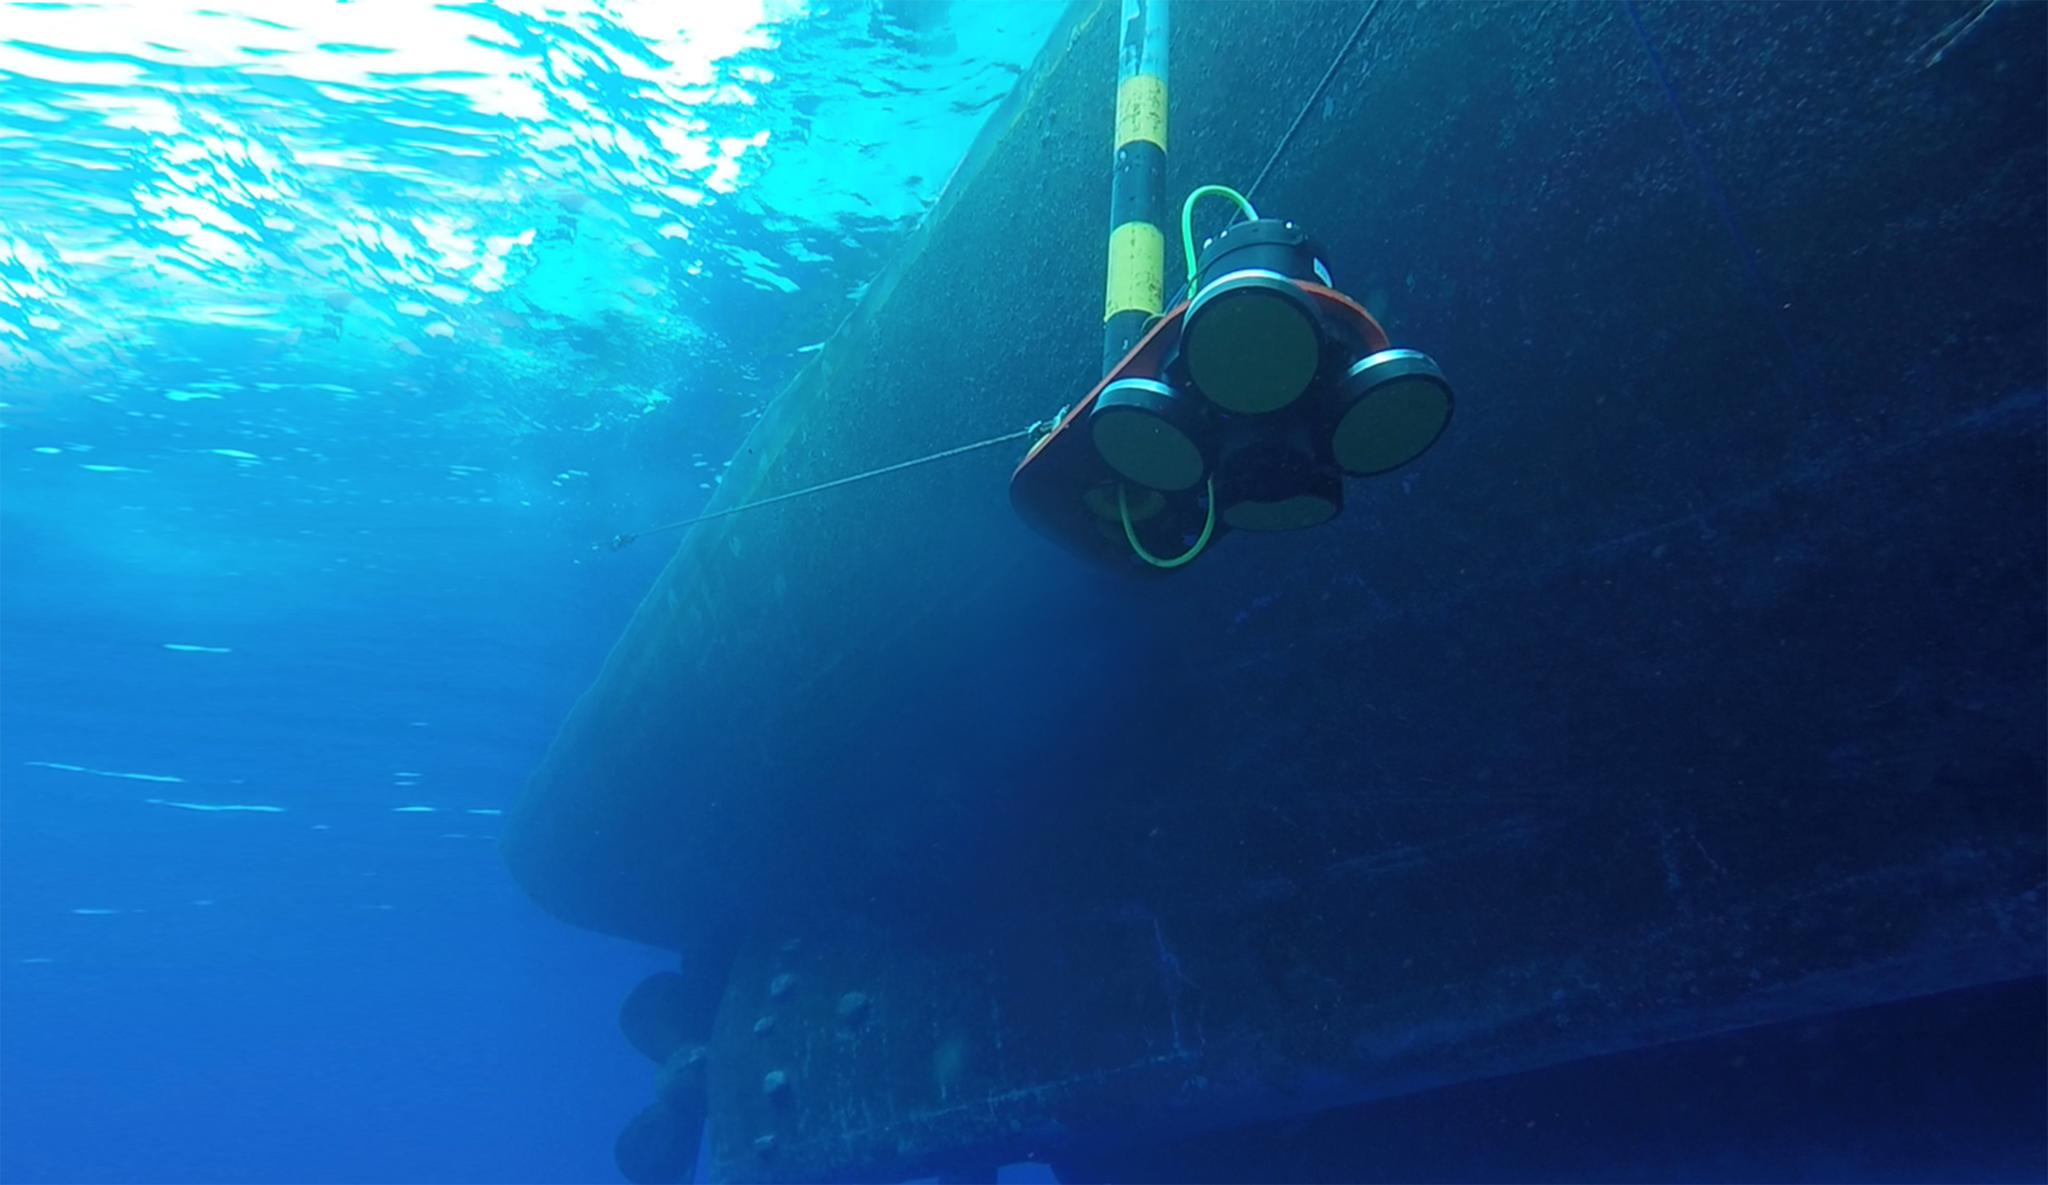
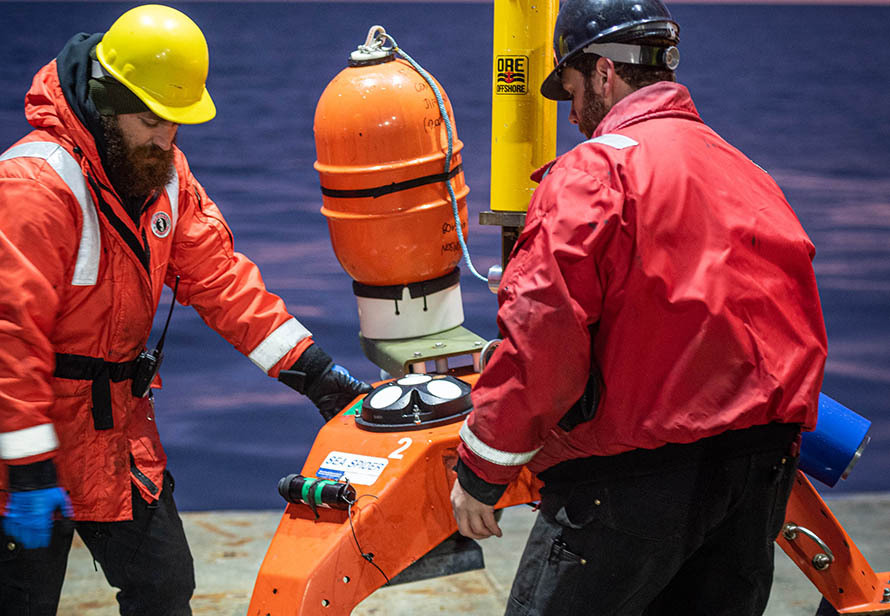
Thomson’s research in the Arctic has continued. Recently, he and his team paired Nortek Signature 500 acoustic Doppler current profilers (ADCPs) mounted on fixed moorings with drifters equipped with Signature 1000 ADCPs to get a complete picture of the Arctic’s changing wave conditions.
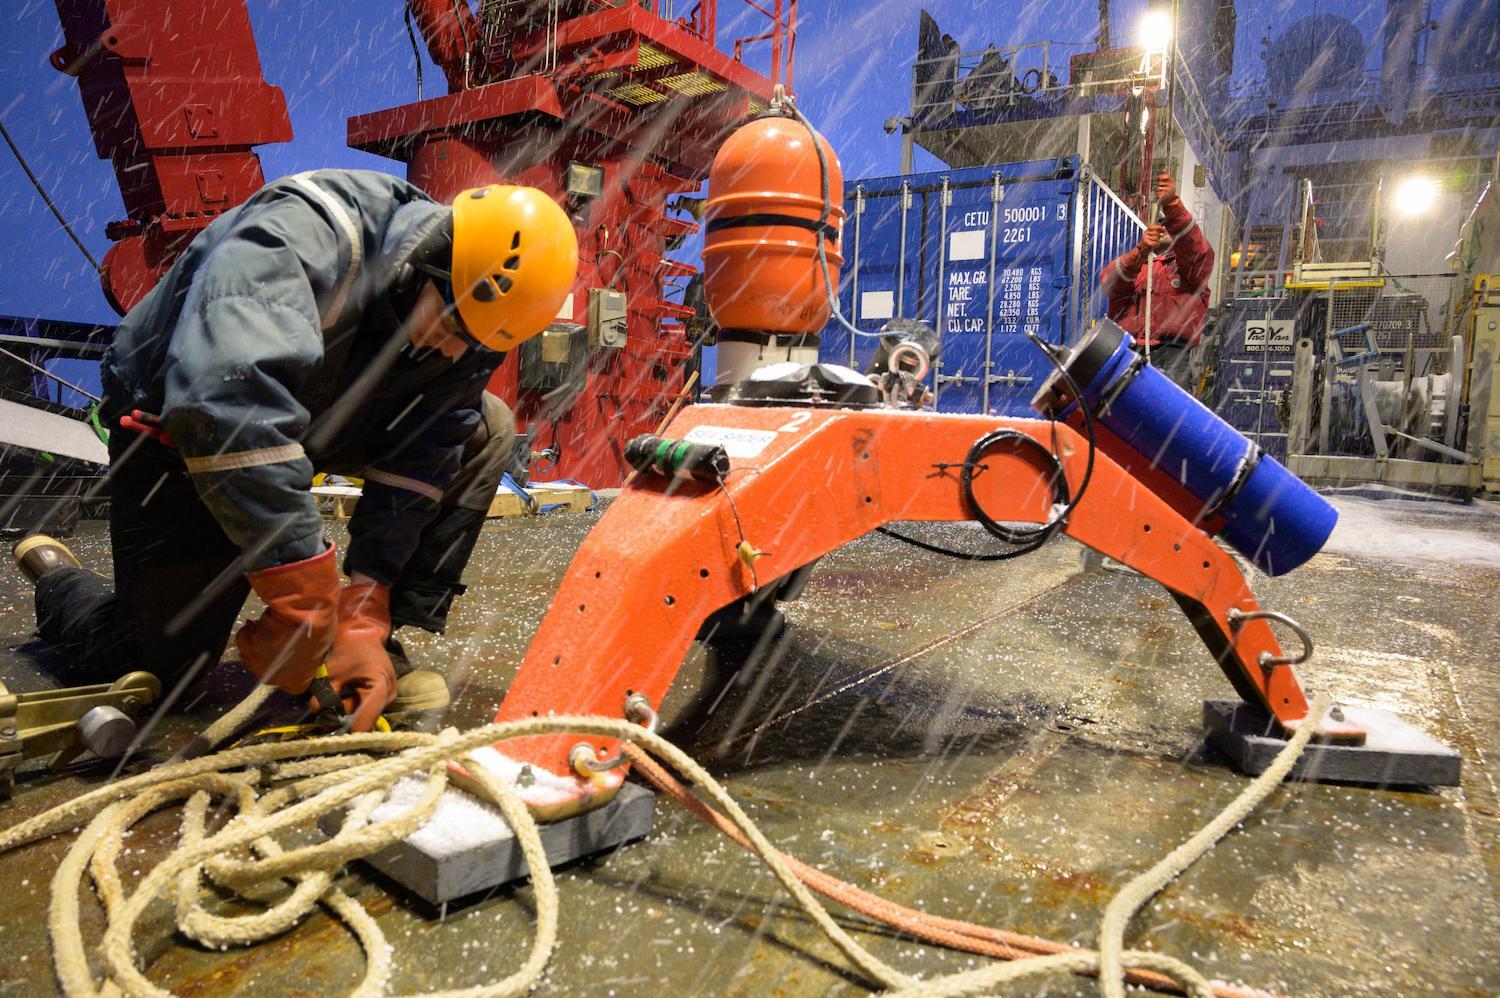
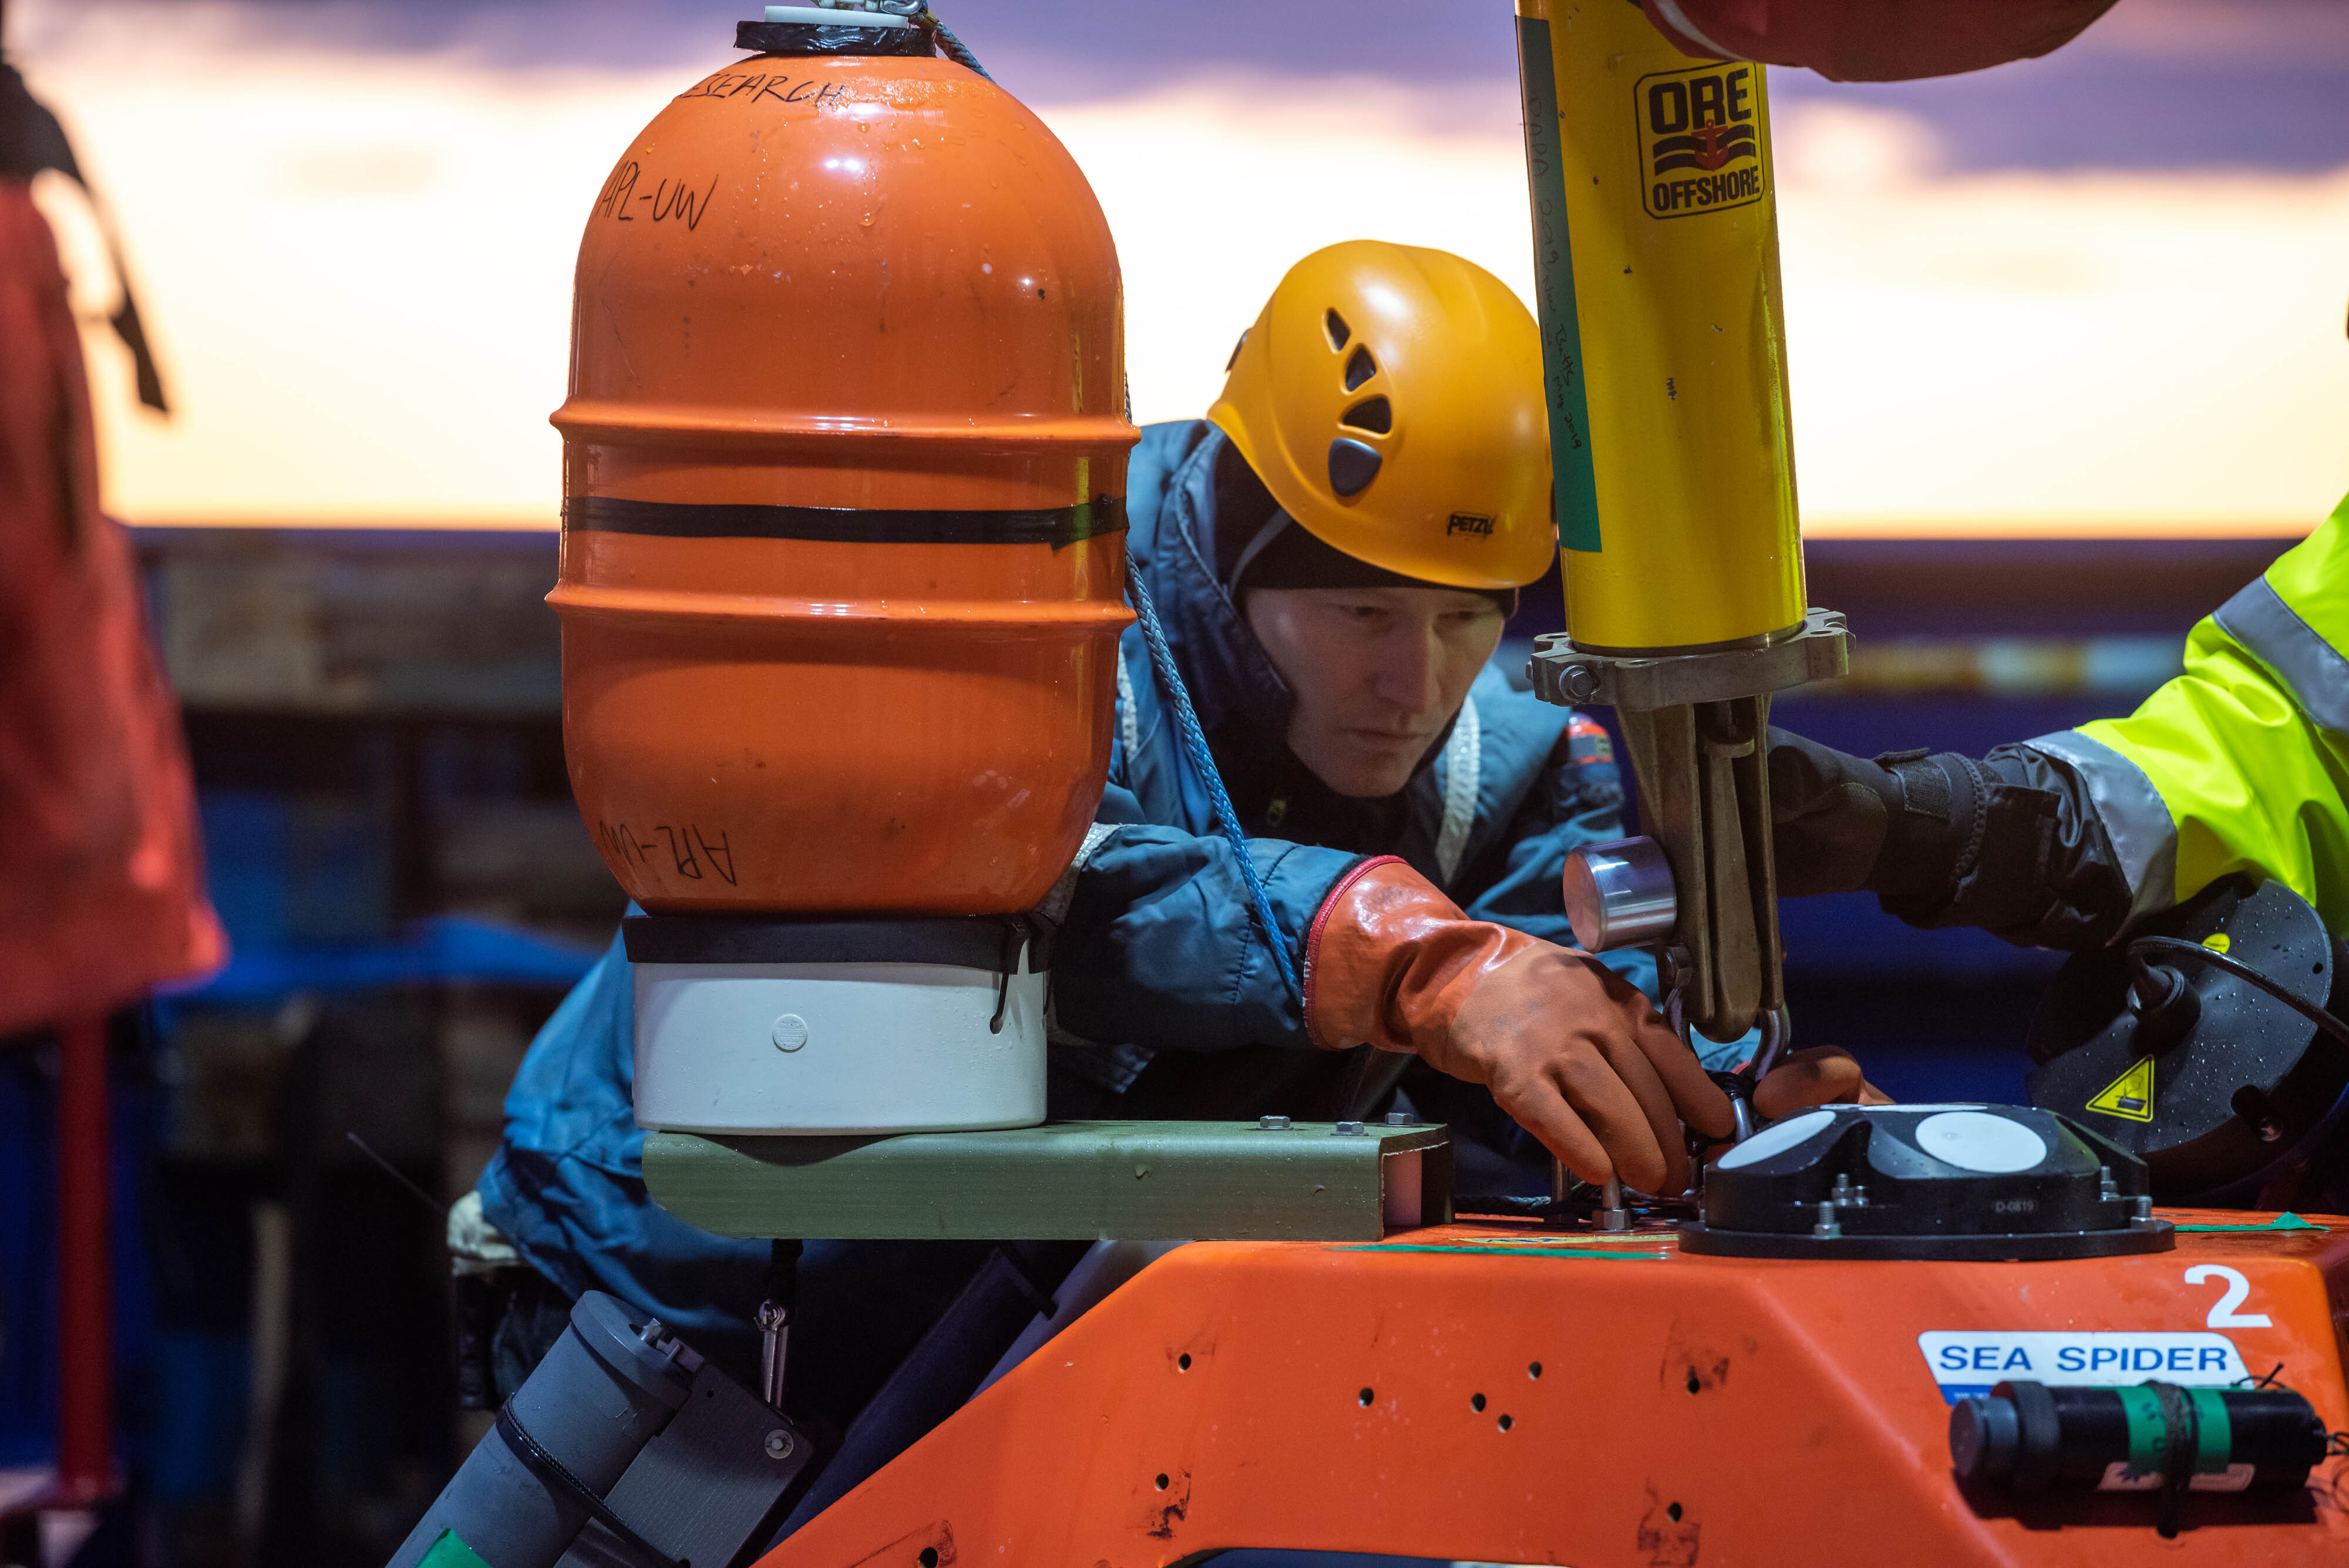
Research enabled by long-term collection of data on waves, currents and sea ice
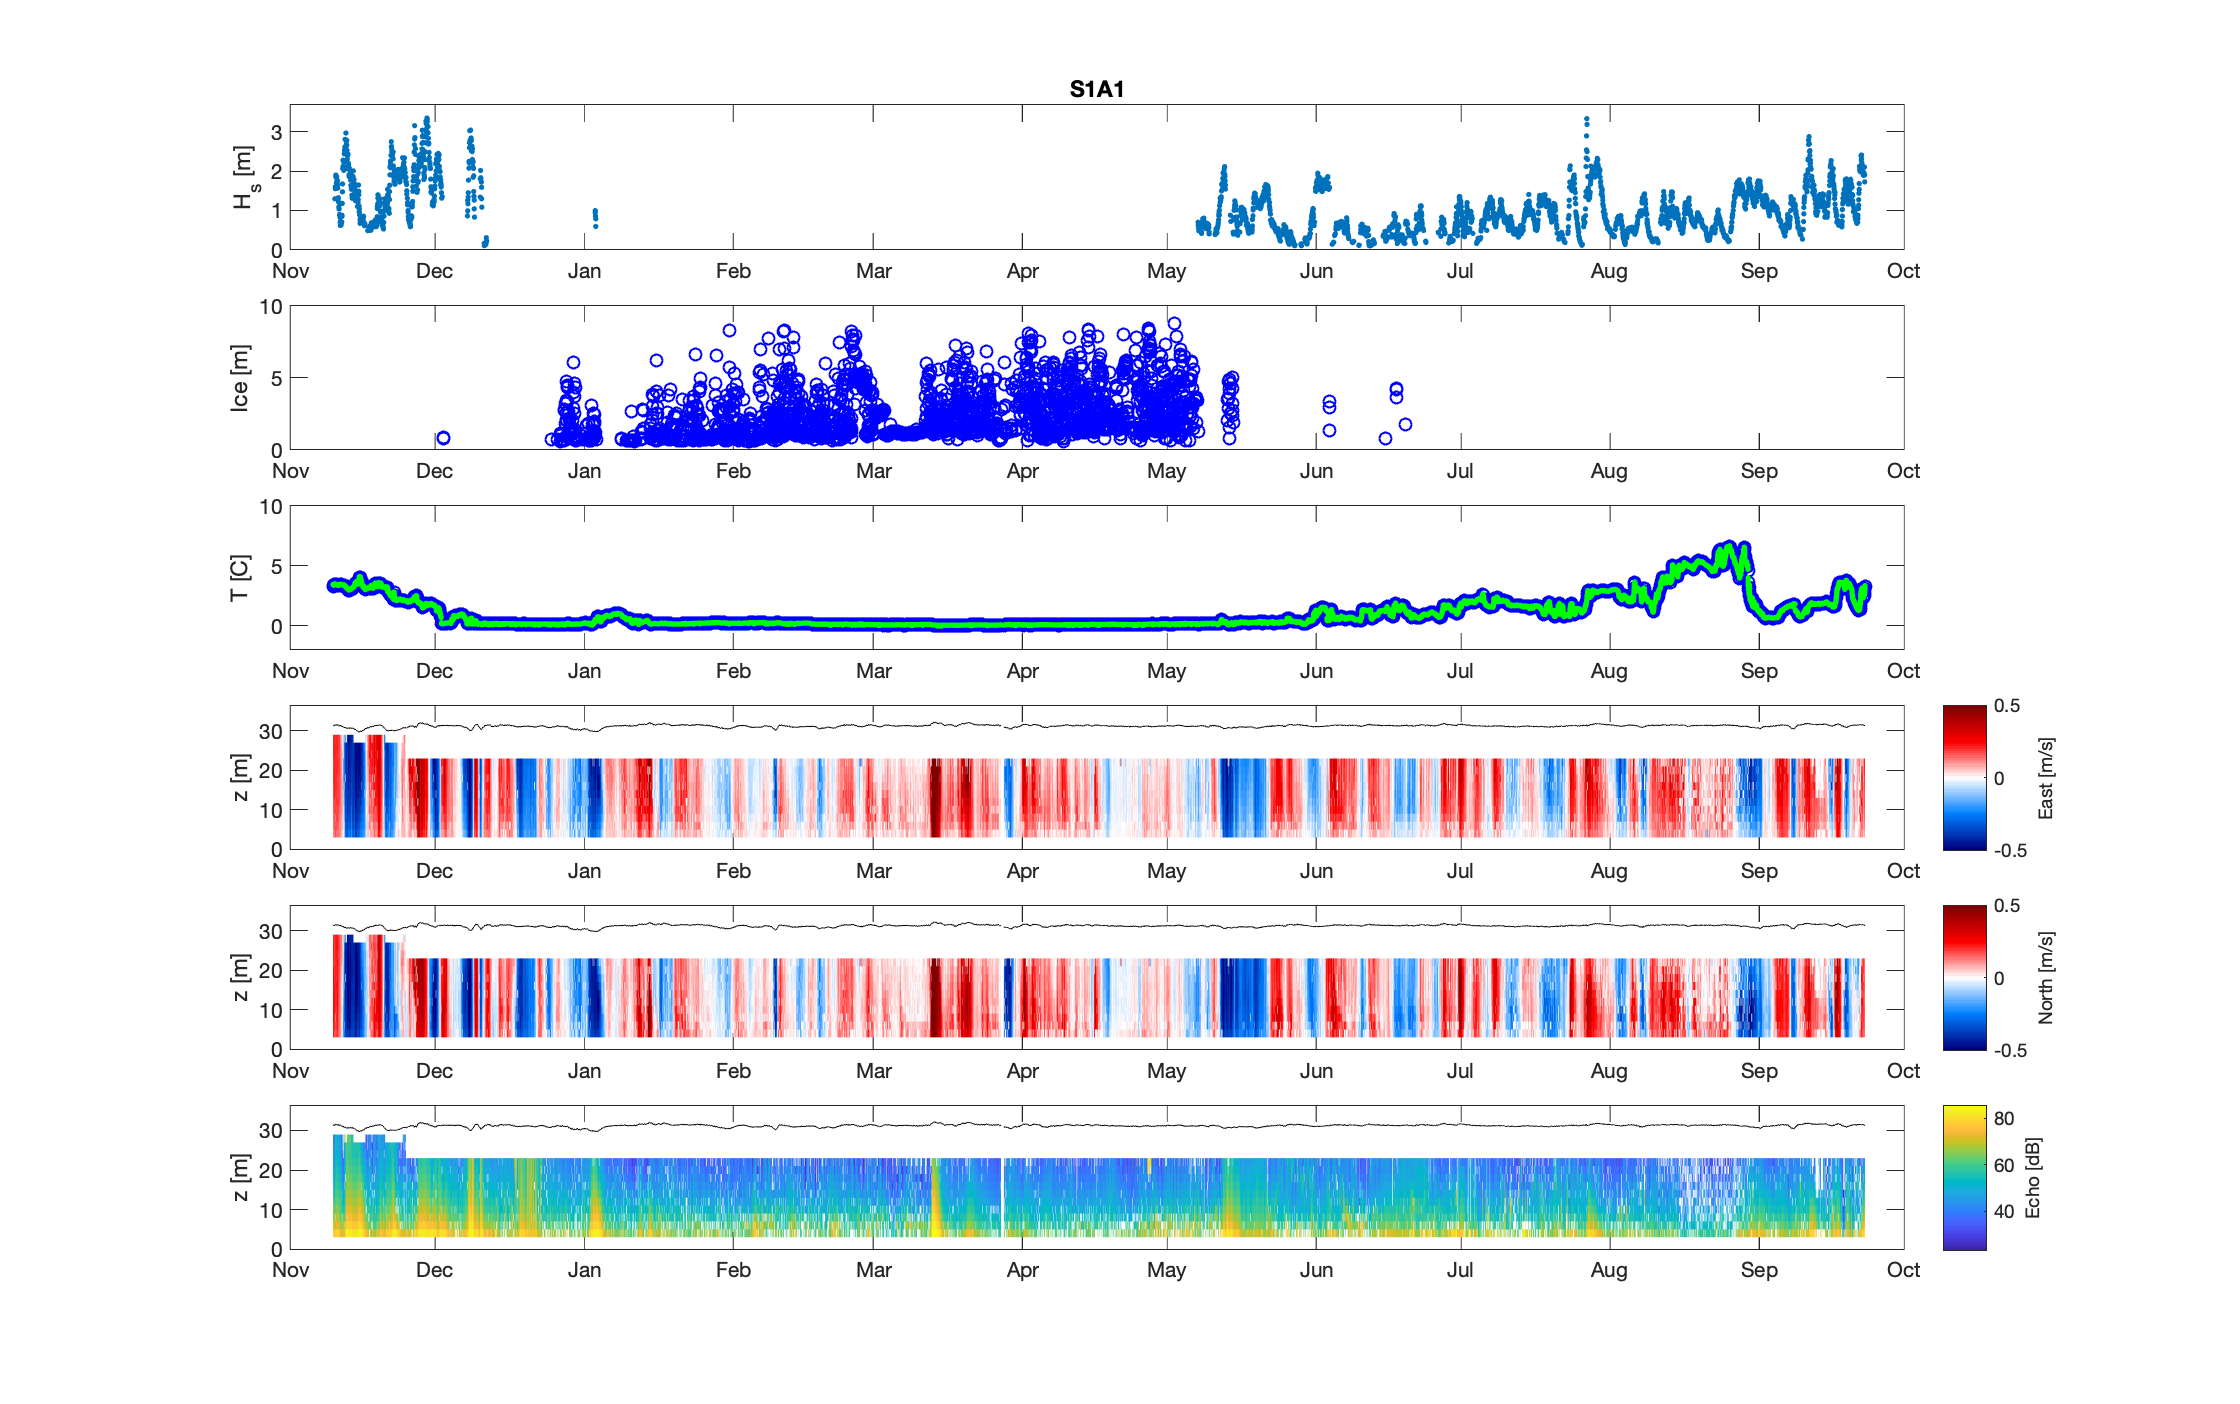
“The moorings [equipped with upward-facing Signature 500 ADCPs] provide us with a long time series of data. They sit at one place, and watch the world go by,” Thomson says. The instruments, which collect data on the waves, currents and sea ice when it is present, are duty-cycled to record data every hour. “They have been great for power management. It’s really good to be able to have the instruments reliably collecting data for a whole year and retain robustness in the data collection,” Thomson says.
Using acoustic Doppler current profilers to assess waves in shallower waters
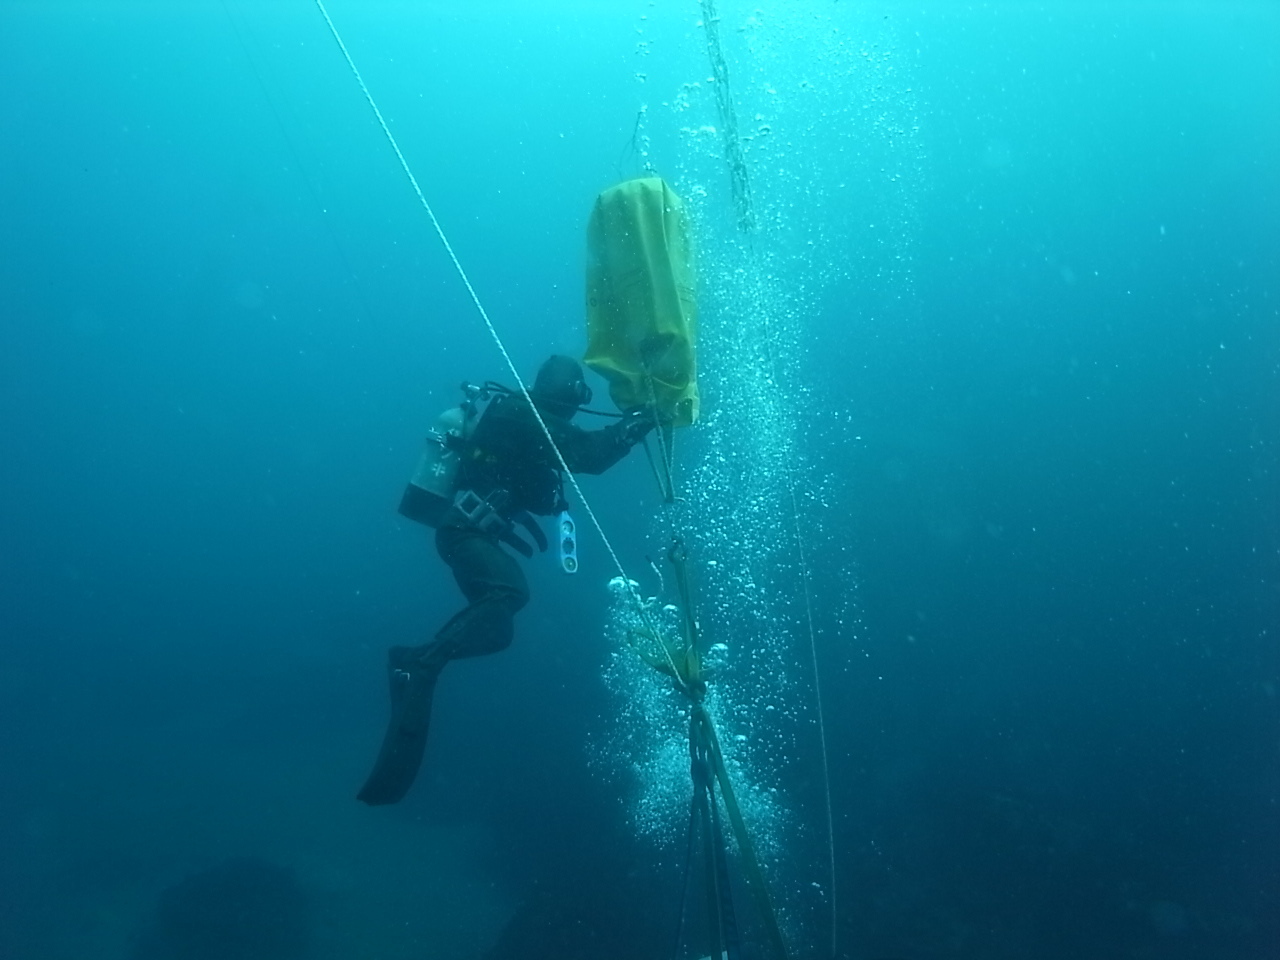
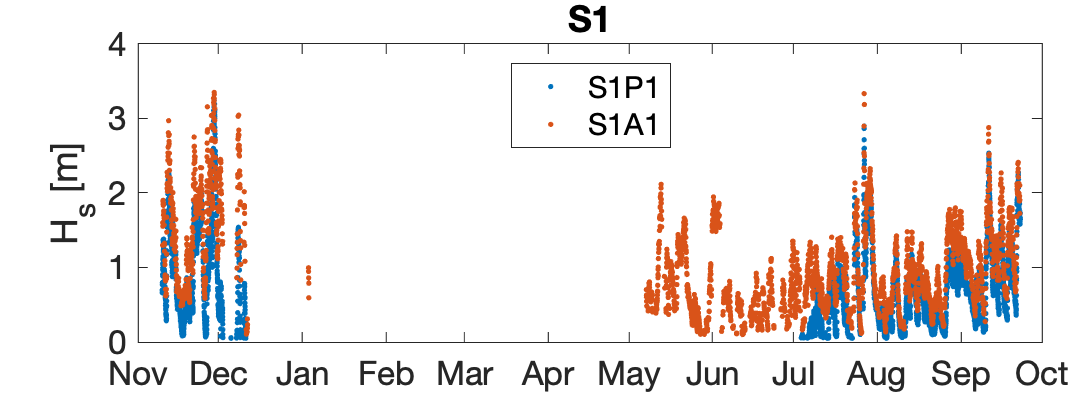
The Signature 1000s have also been attached to moorings to assess waves in shallower waters. In the Chukchi Sea, Thomson and Dr Lucia Hošeková captured a four-day-long wave event near the Alaskan coast, allowing them to explore how sea ice dampens the wave’s energy.
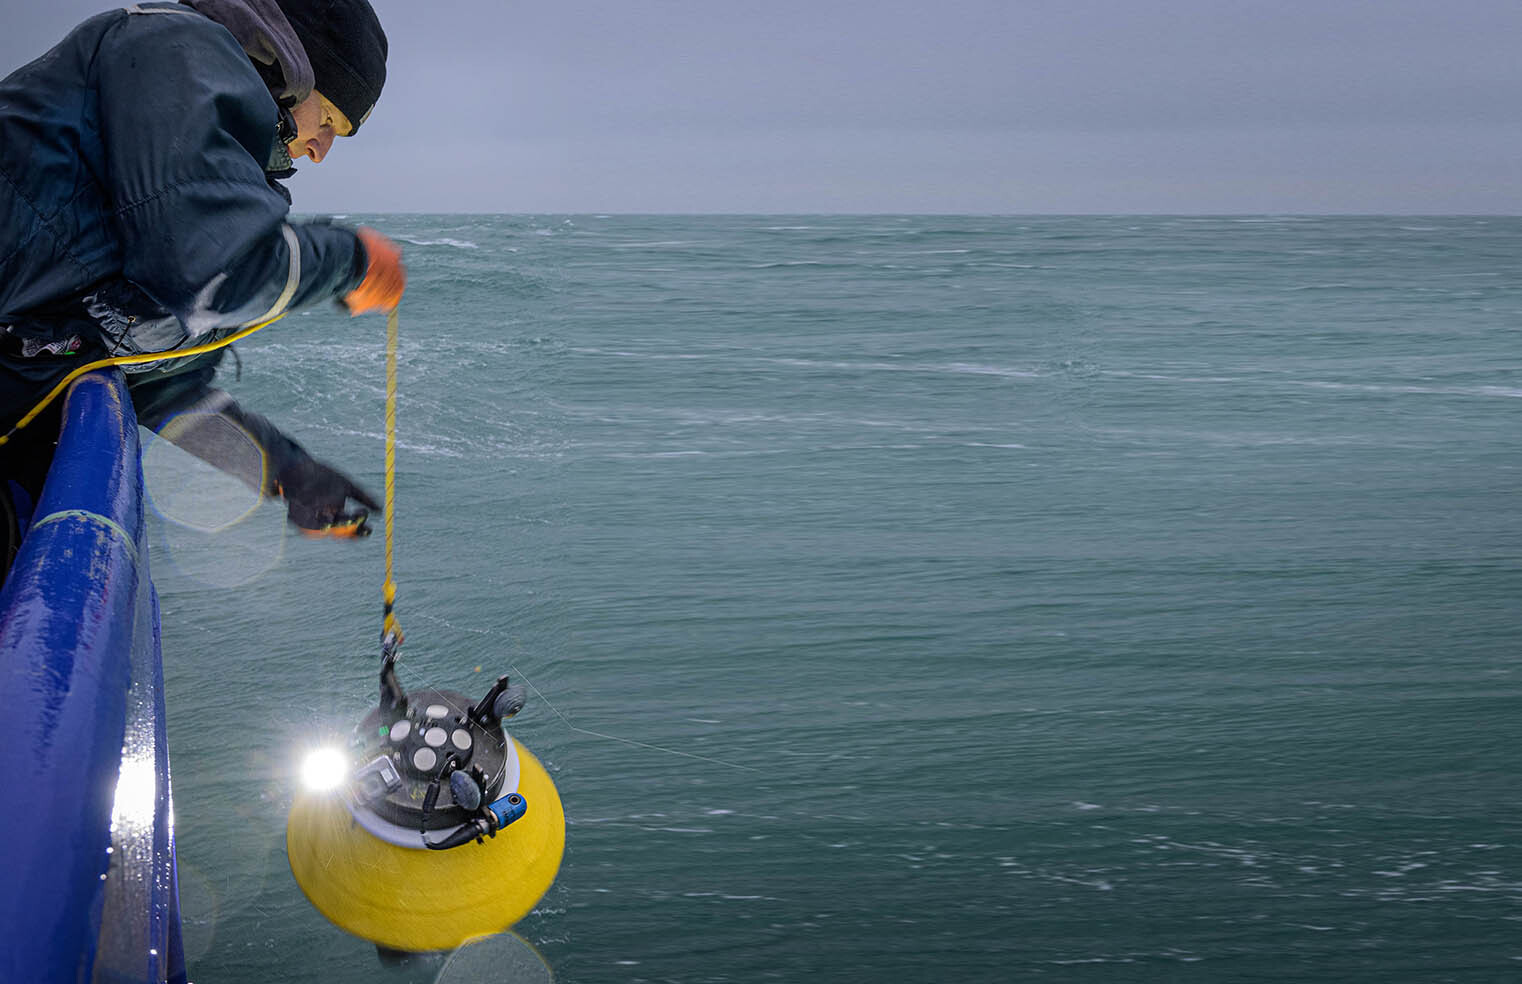
The drifters are, as Thomson puts it, “a totally different animal.” Built by Thomson and his team, the drifters – called SWIFTs (Surface Wave Instrument Float with Tracking) – are designed to operate in harsh conditions. “The SWIFTs are free-floating at the surface, and they just drift, so they’re sort of simple in that regard,” says Thomson. “That puts us in a really neat reference frame. If there’s ice around, we’re moving around the ice, or if it’s just the water, we’re moving with the water. That has some advantages for how we do the analysis because you stay with the same piece of material, whether it’s ice or water, for a while, so you can see how it transforms.”
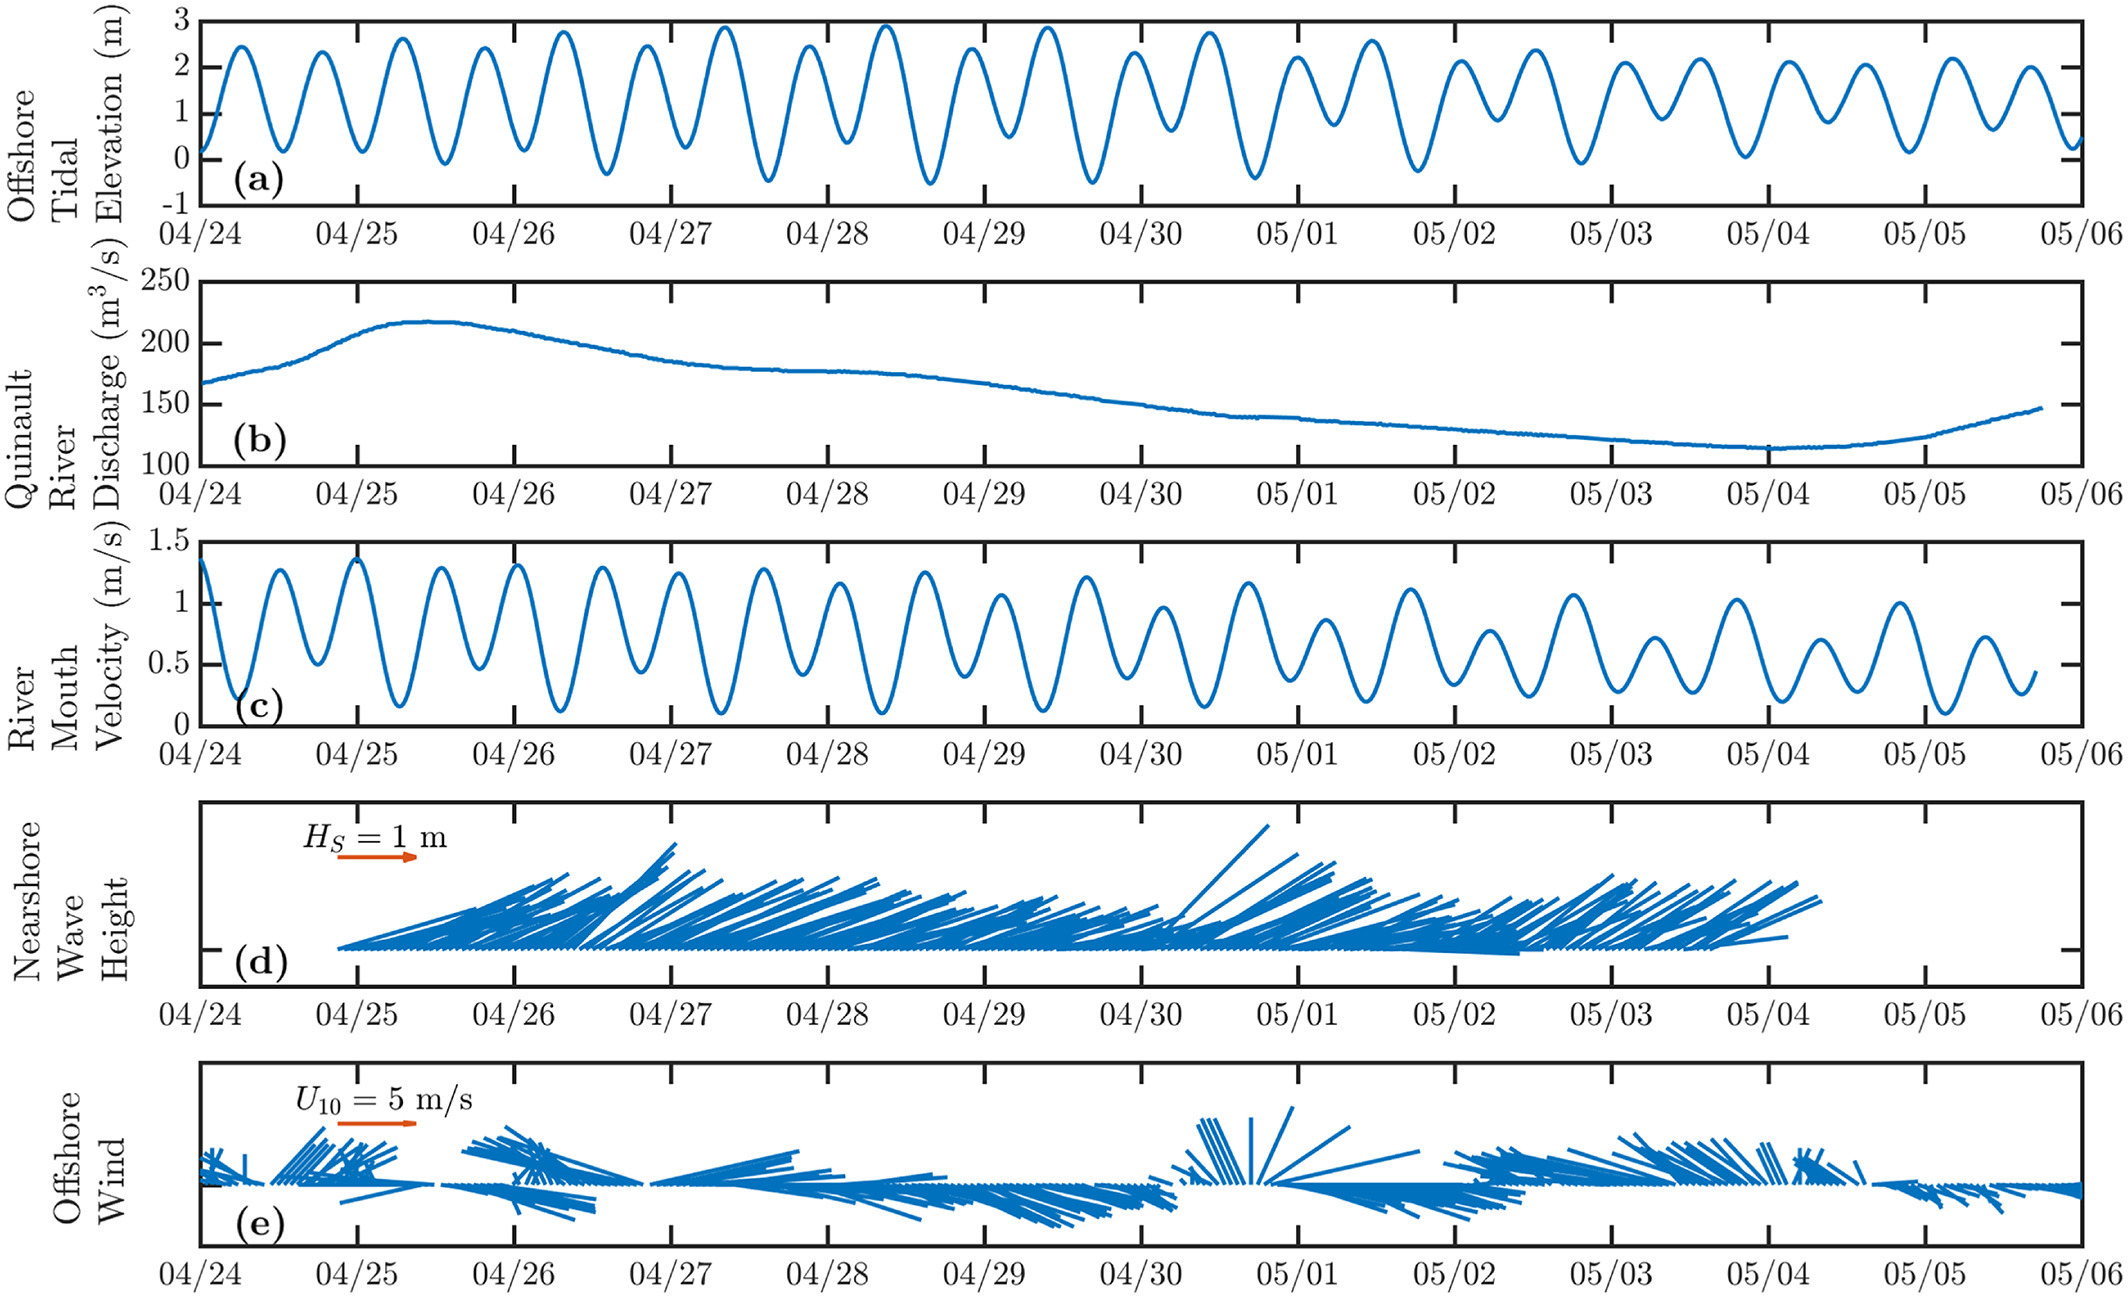
Along with his former PhD student Dr Samuel Kastner, Thomson previously launched a SWIFT down a river and into a surf zone to assess how breaking waves in the surf zone may enhance mixing between the relative freshwater of the estuary and the saltwater of the ocean. While the ADCPs on the SWIFT measured near‐surface turbulence and velocity profiles, Acoustic Wave and Current Profilers (AWACs) mounted in the outer edge of the surf zone captured wave conditions.
Previous versions of the SWIFT were equipped with a downward-facing Aquadopp Profiler 2 MHz, but are now fitted with a Nortek Signature 1000 profiler with an integrated Attitude and Heading Reference System (AHRS) which samples at the same rate as the Signature 1000 acoustic measurements (up to 16 Hz), making it even more adept at measuring turbulence and currents when subject to high-frequency motion.
A next-generation acoustic profiler that really moves things forward
Thomson’s Arctic investigations are continuing, with much of the research being conducted largely made possible by the technical advances being made in the equipment. “The Signature instruments, in general, have been nothing short of a game-changer,” Thomson says, noting the ability of the instrument to capture multiple different types of measurements. “We have a next-generation acoustic profiler that really moves things forward. The data are much cleaner, much higher quality than they used to be.”