A compact DVL improving the efficiency and quality of ROV data collection
- User stories
Researchers at the Norwegian University of Science and Technology (NTNU) have now found that a horizontally-facing DVL is key to solving mapping challenges, while it also reduces the need for highly skilled manual ROV operators.
Researchers at the Centre for Autonomous Marine Operations and Systems (NTNU AMOS) have now developed an ROV-based system for efficient, high quality visual mapping of a steep underwater surface.
Stein M. Nornes, research fellow at NTNU AMOS, explains why this system is of significant benefit for the research community: “Most ROV operations today are heavily reliant on experienced pilots,” he says. “Being able to automate the control can increase both the efficiency and quality of data collection, while freeing up time and resources,” Nornes adds.
Results from a test survey carried out by researchers at NTNU AMOS have demonstrated how the DVL measurements enabled the Dynamic Positioning (DP) system to efficiently map a vertical underwater wall with still imagery, while maintaining a constant distance to the face of the wall for ideal image quality and coverage.
Developing a motion control strategy for distance-keeping
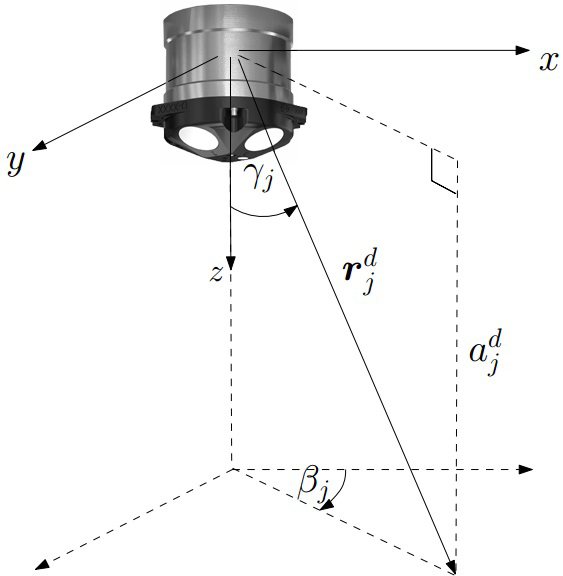
The main scientific contribution is in the development of the motion control strategy for distance-keeping, using measurements from a DVL mounted in an arbitrary orientation.
Watch video: Using a DVL on an ROV to map a horizontal wall
Because this approach relies on sensors that are common to the majority of ROVs, it could easily be adapted to a wide range of ROVs, reducing reliance on highly skilled manual operators. An efficient post-processing strategy using commercially available software was applied to the collected data, further reducing the required resources for the end user.
A tiny DVL made things simpler
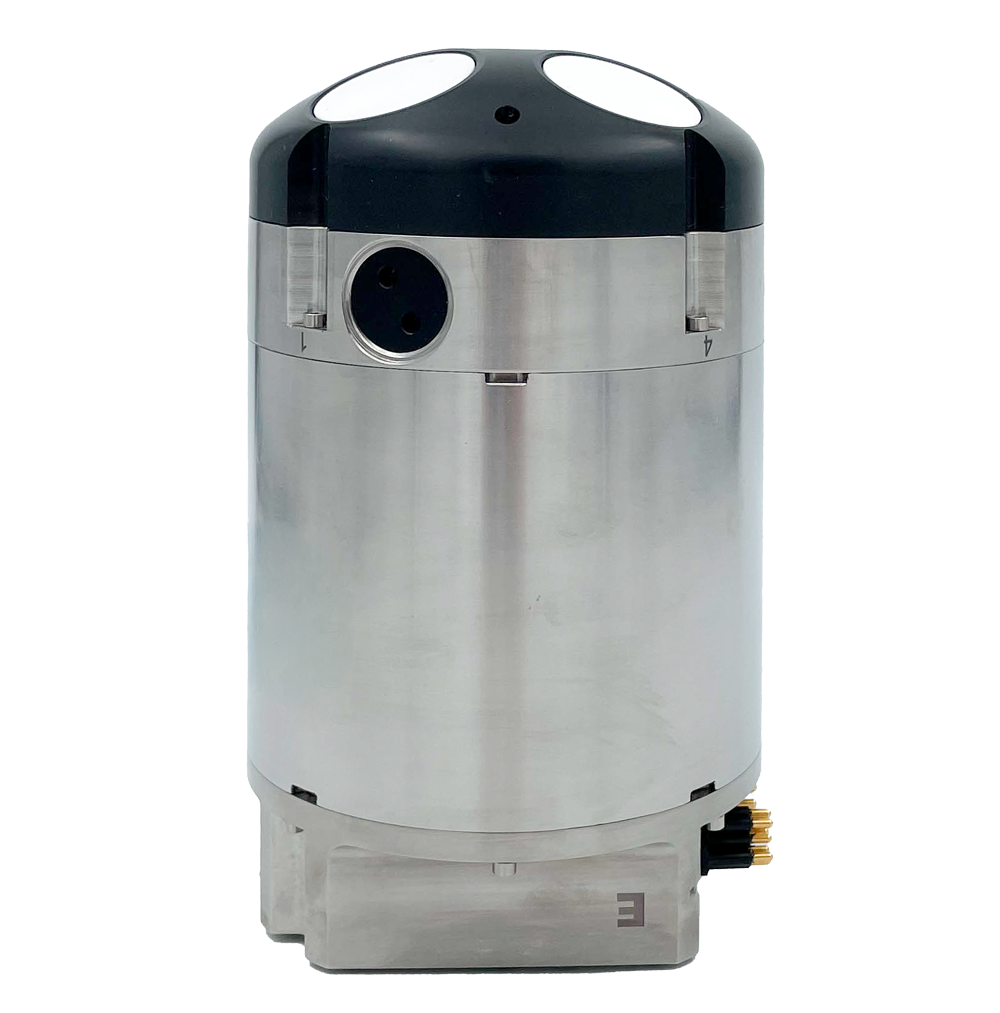
Why did researchers at NTNU choose the Nortek DVL for this project?
Stein Nornes explains that the compact size of the Nortek DVL was of vital importance. “For the project, we needed to mount a DVL facing forward on our ROV. With the comparatively tiny Nortek 1 MHz DVL, we only needed a simple mount, and could place the instrument exactly where we wanted it. In comparison, the DVL we already had on the vehicle is large and heavy, which would have required very robust mounting, and it limited our options with regards to where the instrument could be mounted on the ROV.”
Helping biologists map biodiversity quickly and efficiently
Geir Johnsen is a professor in marine biology at the Department of Biology (NTNU), and is one of the founding partners in Ecotone, an NTNU spin-off company using new optical techniques for mapping and monitoring the marine environment. He emphasizes that the work that has been done to integrate the DVL in the operation is important for biologists, as it helps to improve control of the ROVs that are used in the visual mapping of steep underwater walls.
“To get good data we as researchers need to control speed, pitch, roll and yaw. It is particularly important to control vertical and horizontal movement to get good images of the submarine environment,” Johnsen says.
“Automated control of these robots, for example ROVs, helps us run these with greater precision than a pilot could deliver, and we can map large parts of the ocean floor quickly and efficiently.”
Johnsen emphasizes that the DVL gives very good information on the distance to the bottom.
“This helps us make maps of the biological diversity that are of a very high quality.”
Achieving good image quality and complete coverage
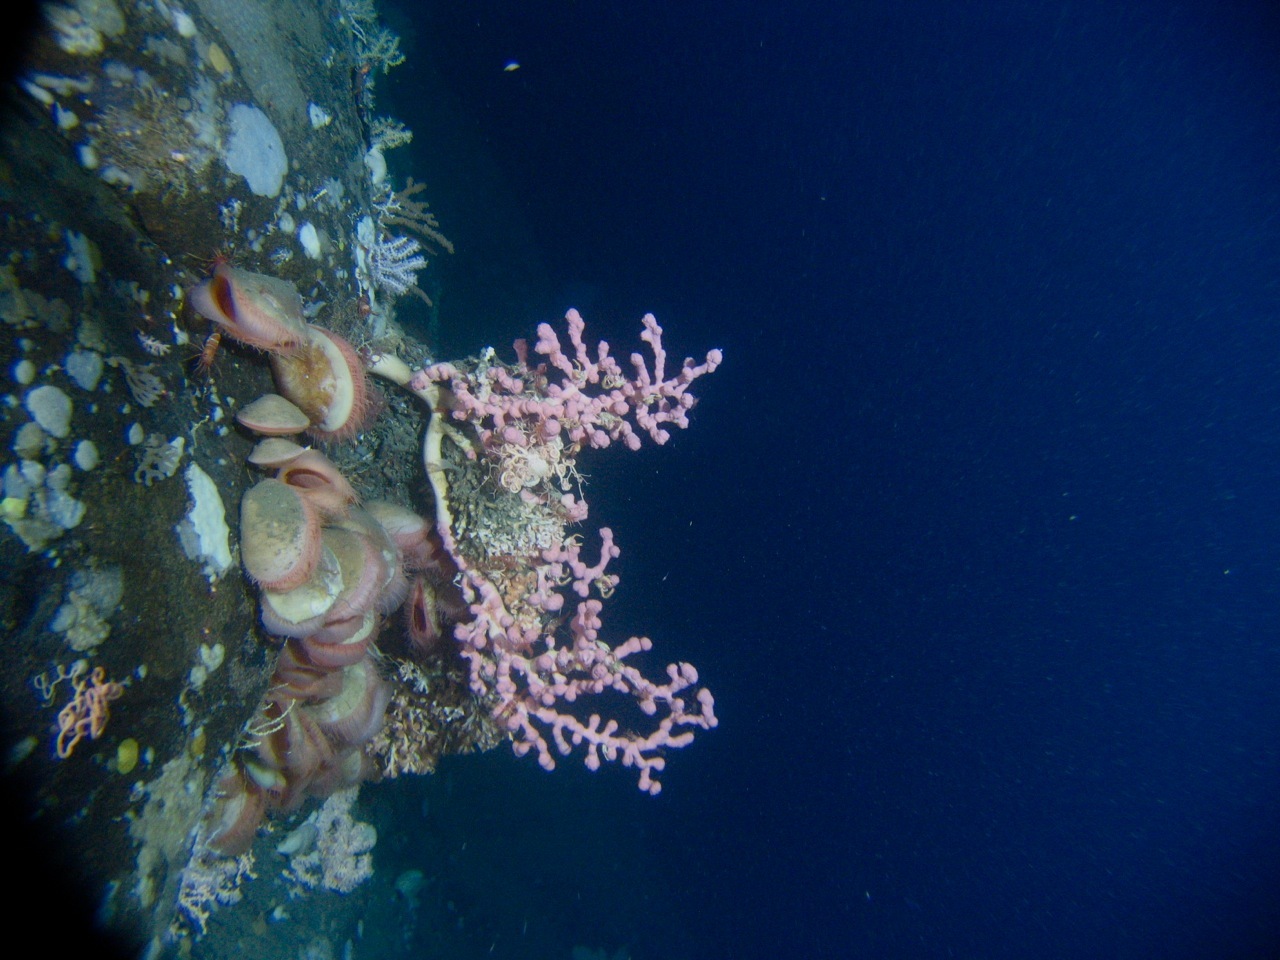
The DVL enabled the research team to efficiently map a section of a subsurface wall with still images, while ensuring good image quality and complete coverage. The test was carried out in Trondheimsfjorden, a fjord in Norway.
“Getting the velocity and altitude measurements from the forward-facing DVL enabled us to run the ROV in an automatic pattern on a vertical rock wall while maintaining a constant distance to the wall,” says Stein Nornes.
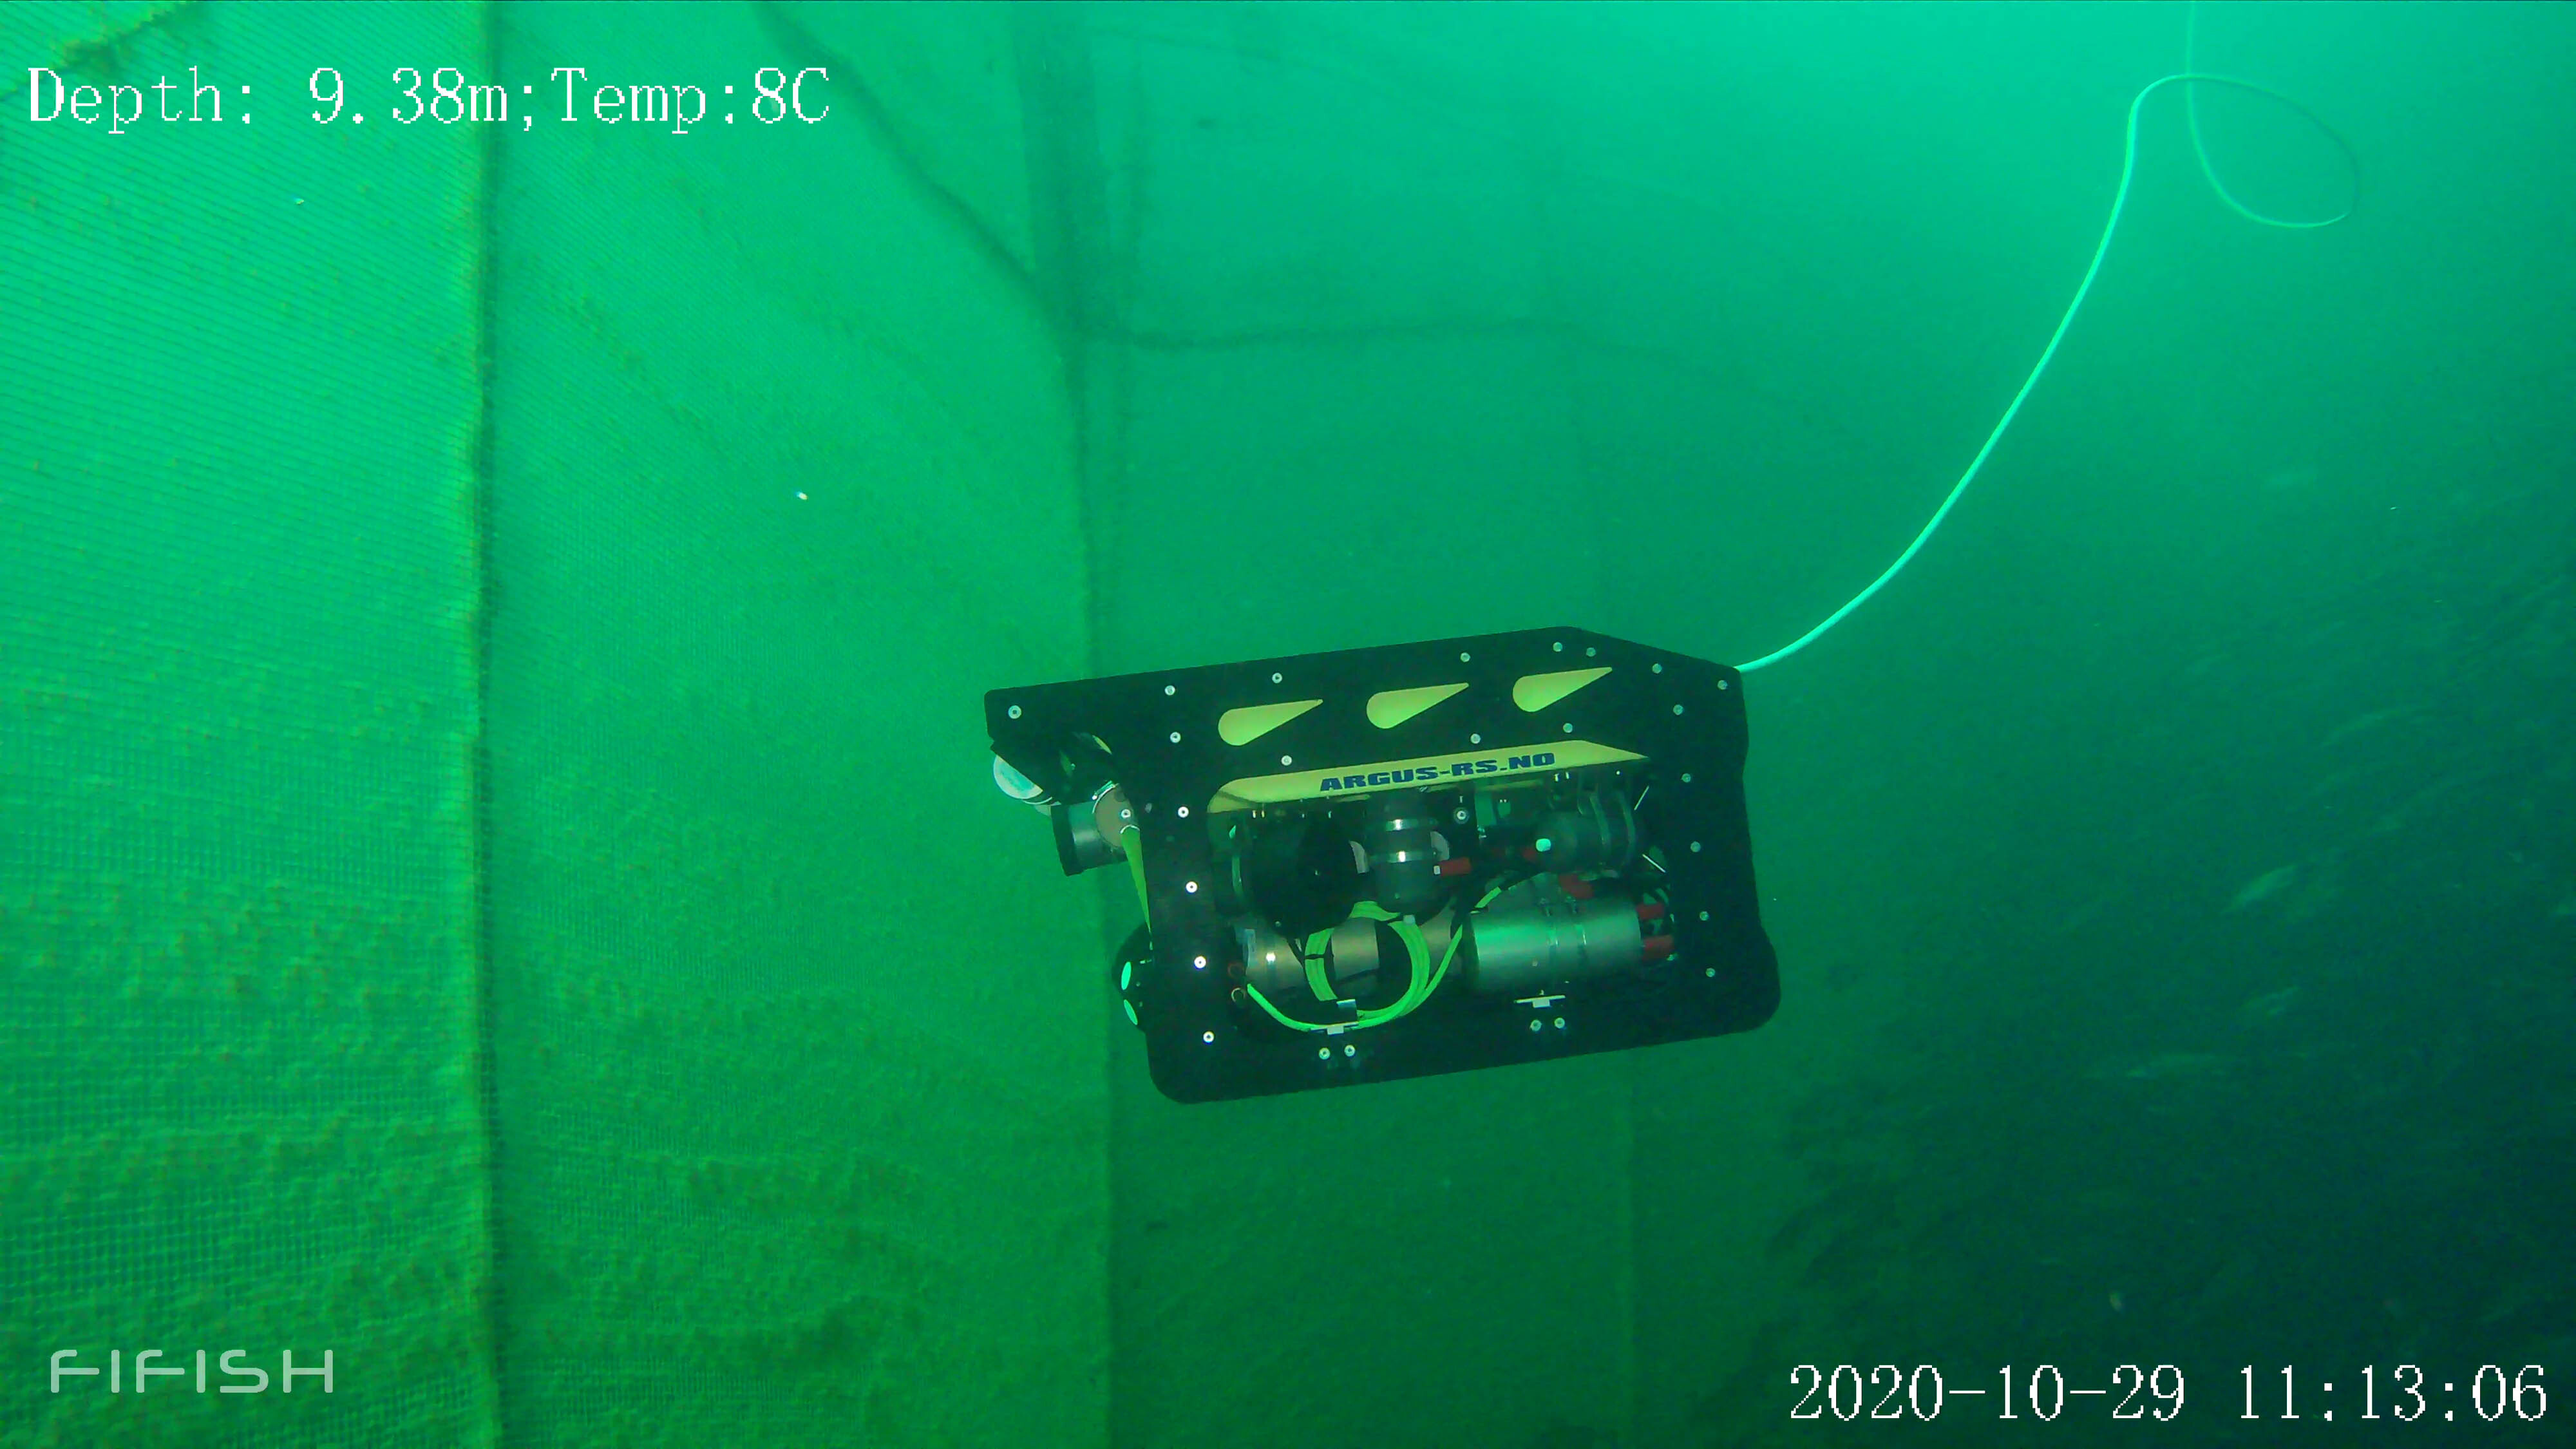
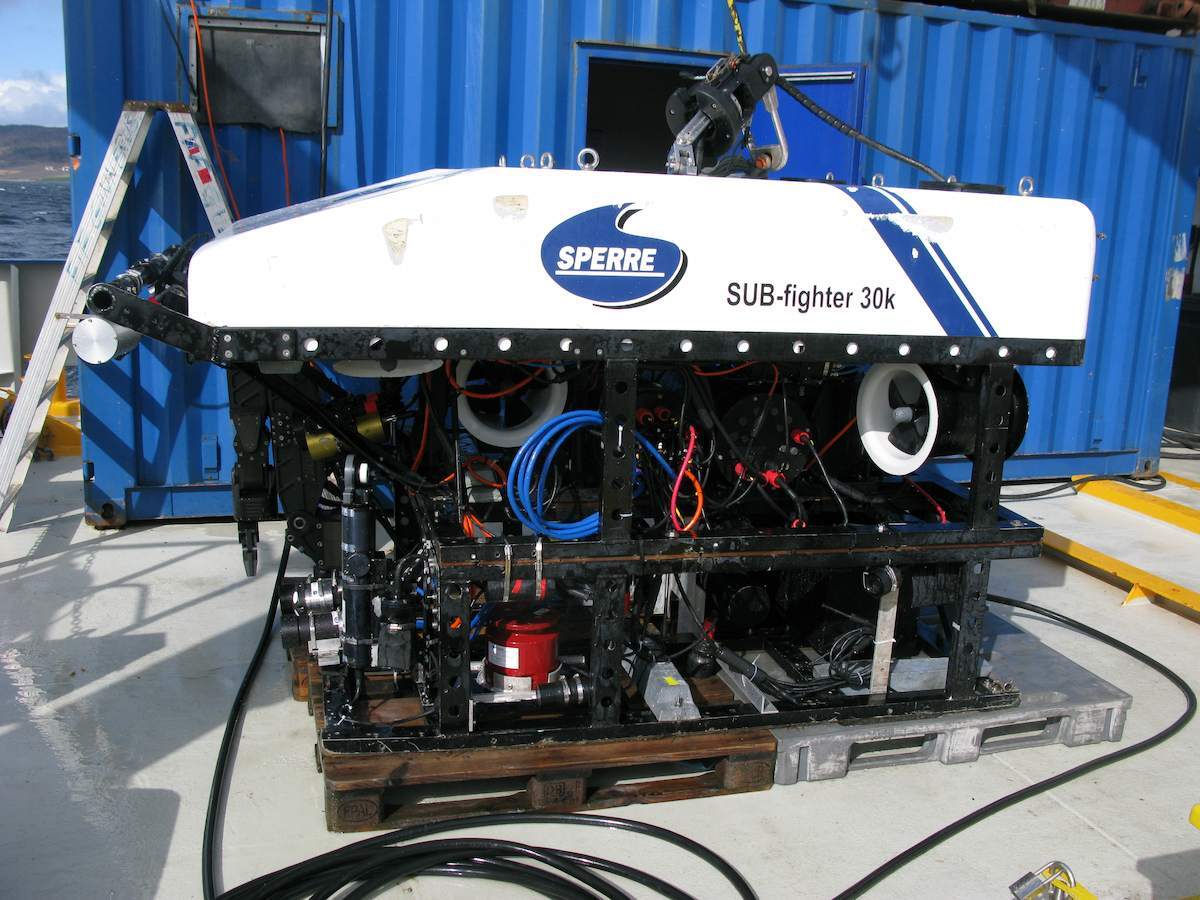
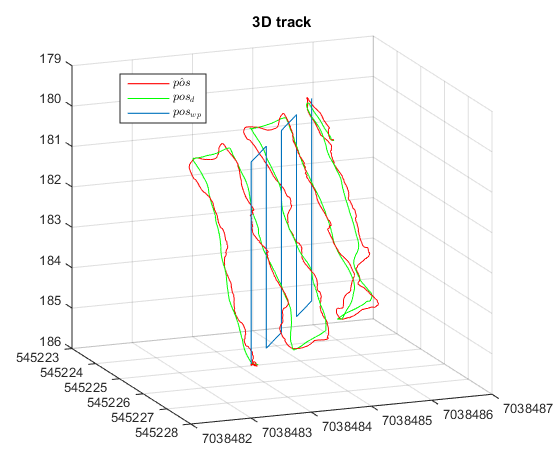
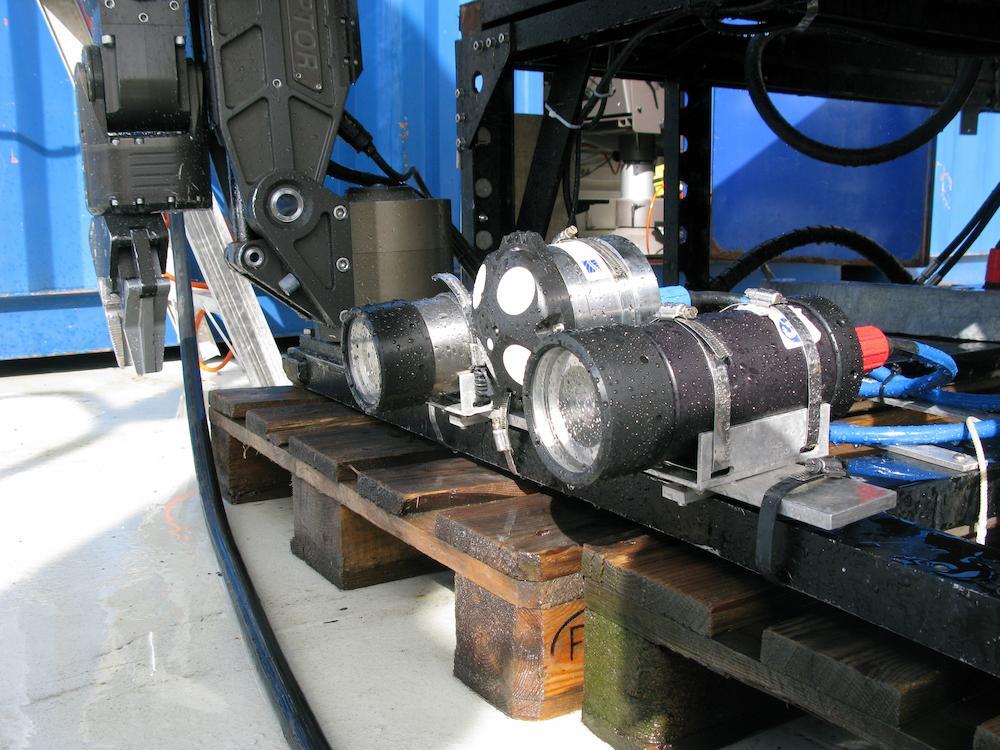
The ROV was equipped with a combined stereo camera and DVL rig. The DVL was a standard 1 MHz DVL from Nortek, with no hardware modifications. The chosen survey area was a rock wall with an approximate inclination of 70 degrees located at 175–200 m depth. The main guidance module of the ROV was programmed to move along a pattern of five parallel vertical 5-meter-long lines with 1 meter linespacing to cover the face of the rock wall with sufficient level of overlap.
“The DVL was mounted in between the two still image cameras on the front of the ROV, facing forwards. The input from the DVL is transmitted via serial communication to the dynamic positioning system we are continually developing at our university,” adds Nornes.
This helped the NTNU team get data on velocity relative to the wall, which was used to track the ROV’s movement, as well as the four distance measurements, which were used to keep the ROV at a constant distance from the wall.
“The velocity is essential in order to maintain a smooth positioning of the ROV. Keeping a constant distance to the wall helps counteract difficulties with image quality related to light attenuation in water,” Nornes explains
The value of precise data in automated visual mapping
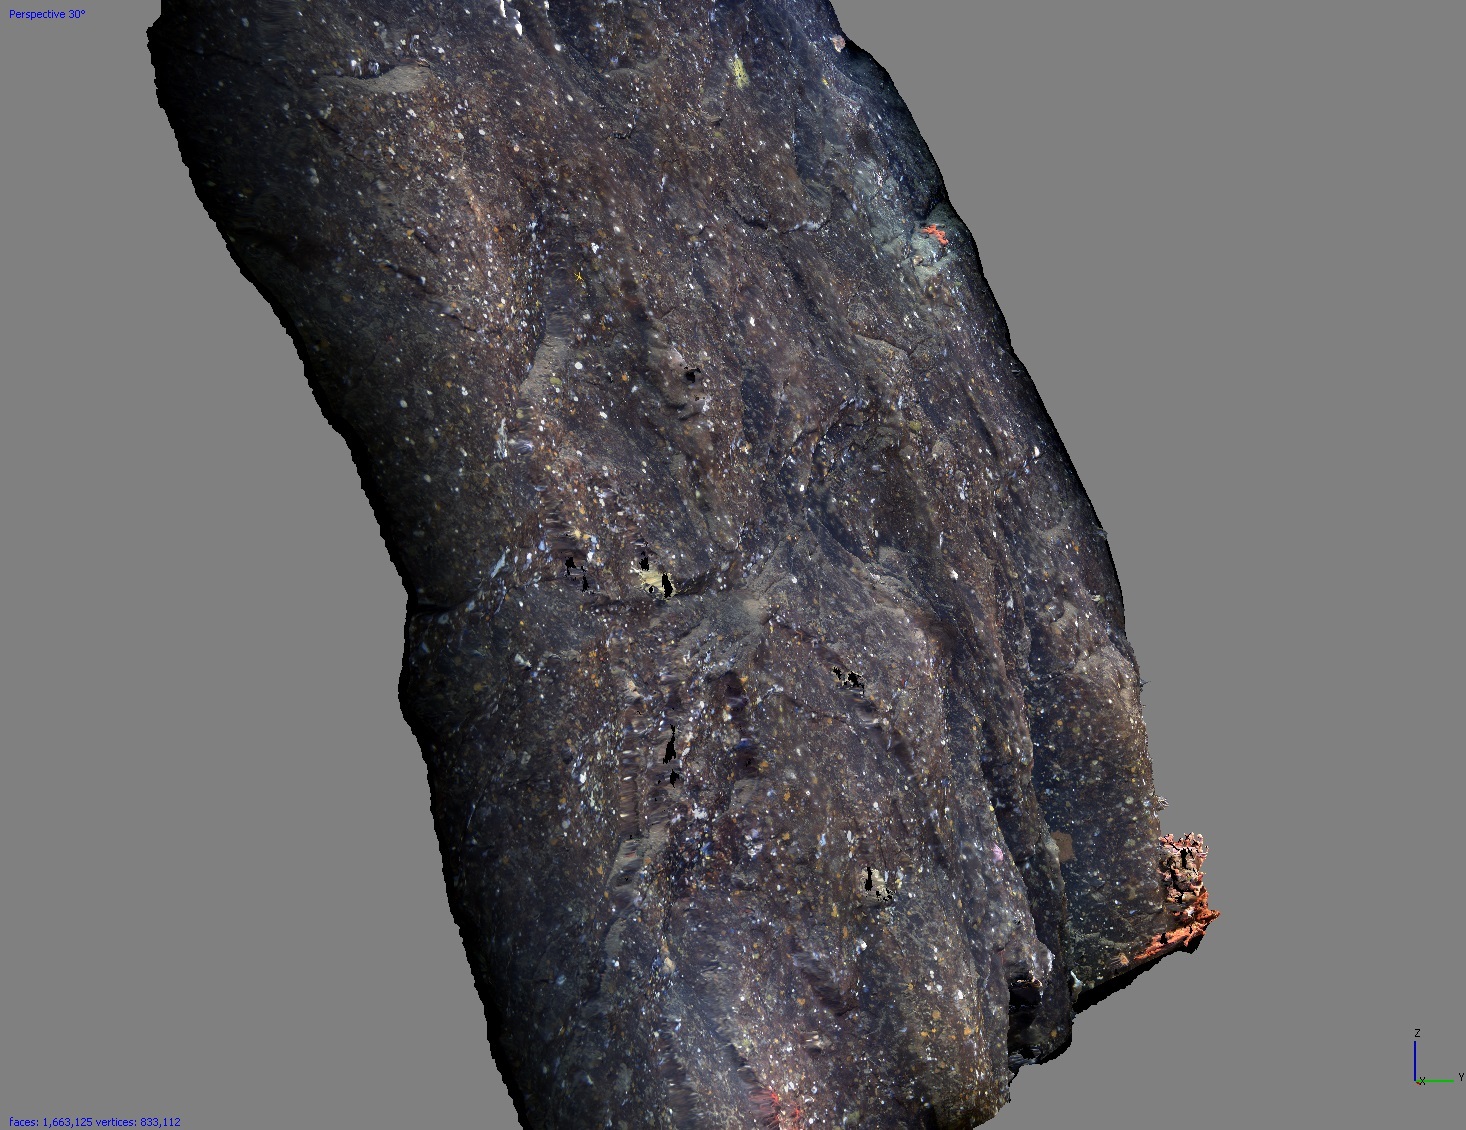
The still images recorded by the stereo cameras of the ROV are post-processed into a 3D photogrammetry model using a combination of commercially available software and freeware.
“The system designed was able to maintain a distance error well within acceptable limits. The image quality was generally high, even when one of the lamps malfunctioned,” Nornes says.
“From the engineering side, we mainly use the data to test and improve our control and guidance algorithms. At the same time, we also work with biologists who would like to use the system for mapping of corals and other biology on the wall in the same area.”
What can be improved in future surveys
Stein Nornes outlines factors he thinks would improve operational flexibility and performance in the next round of underwater wall surveys:
“Having the DVL angled 20 degrees downward to better match the inclination of the wall would also have been an improvement. A pivot mount for the DVL would increase the flexibility of the system, allowing it to map features with varying slopes.”
He also adds that the ability to detect obstacles and sudden changes in inclination in the path of travel would be an important addition to the system. This can be achieved by adding additional sensors orientated in the direction of travel. An additional benefit of using multiple sensors for the same purpose is the increase in redundancy.