Two problems in sediment measurements tackled
- Company & product news
- Perspectives
Scientists have been using ADCP backscatter to study morphodynamic phenomena for over three decades. However, is this the optimal way to measure sediment with an ADCP? There are two problems with this approach. The first thing that stands out is the rather poor spatial resolution; the second is the large number of outliers near the surface (see the example below).
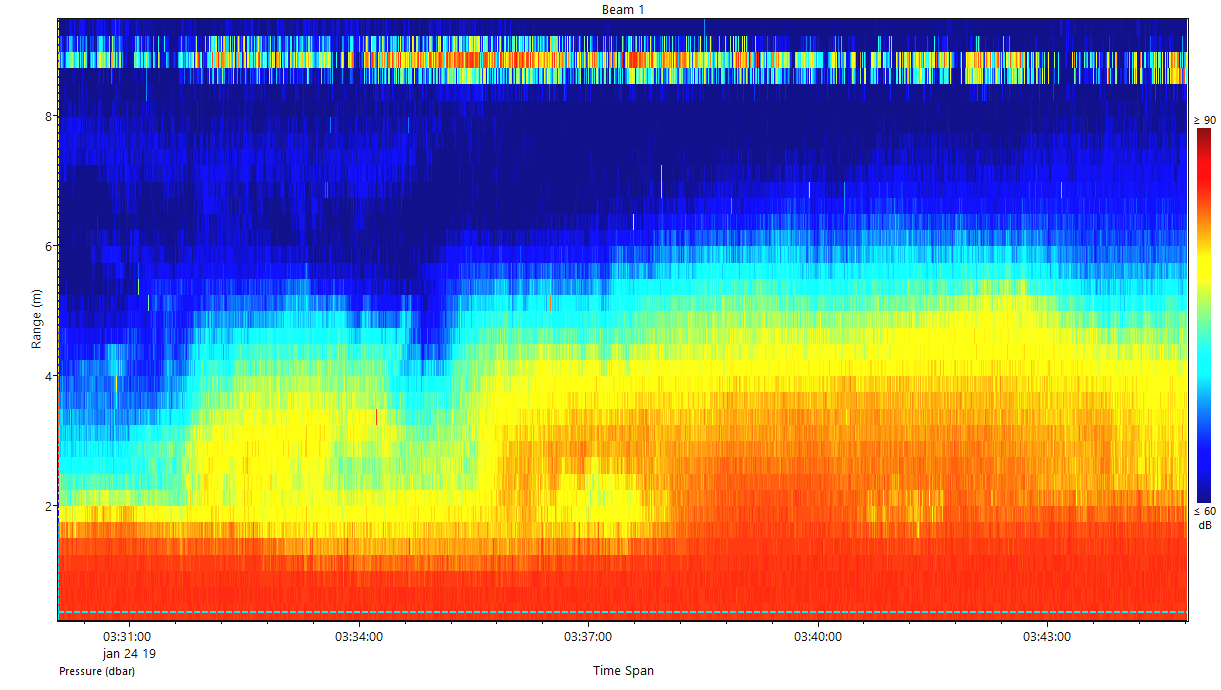
Time series of backscatter intensity of beam 1 of Signature1000, deployed in Ems-Dollart estuary at 9 m depth. Instrument is located on the seabed and is directed upwards. Vertical resolution is 20 cm and outliers are visible in a range of 80 cm near the surface.
What are the implications of these two problems?
The result of these shortcomings is that you end up with a time series that is acceptable for determining large structures of sediment transport, but not useful for studying more detailed structures. Furthermore, the large portion of missing data near the surface means that interesting phenomena near boundaries cannot be studied. And where do we find most interesting sediment phenomena? Exactly – near the surface and in detailed structures.
If researchers could choose their specifications, no doubt they would tell us: “Please increase the spatial resolution in the vertical – and could you do something about the outliers near the surface?” Detailed processes like sediment settling, impact of surface waves, internal waves and currents and sediment near boundaries should be visible directly in the data.
Improving sediment measurements with ADCPs
First, let’s consider the cause of the problems in more detail. Why do we see low resolution and outliers? The cause of the poor resolution and missing data near the surface lies in the design of the ADCP. The ADCP has been designed to measure currents. To receive sufficient information from the reflected sound, measurement cells need to be bigger than what you require for backscatter only.
In addition, the missing data near the boundary is caused by the ADCP’s purpose: to measure currents. It is called the sidelobe effect. To be able to measure currents perpendicular to the instrument’s orientation, the acoustic beams are slanted by 25 degrees. Acoustic leakage outside of the beam causes data near the surface not to be seen. This is the case for all ADCPs with slanted beams.
An ADCP integrating an echosounder mode
Nortek took the concerns seriously and provided a solution in the Signature1000 ADCP. We integrated an echosounder mode, so you can measure currents and make detailed echograms at the same time.
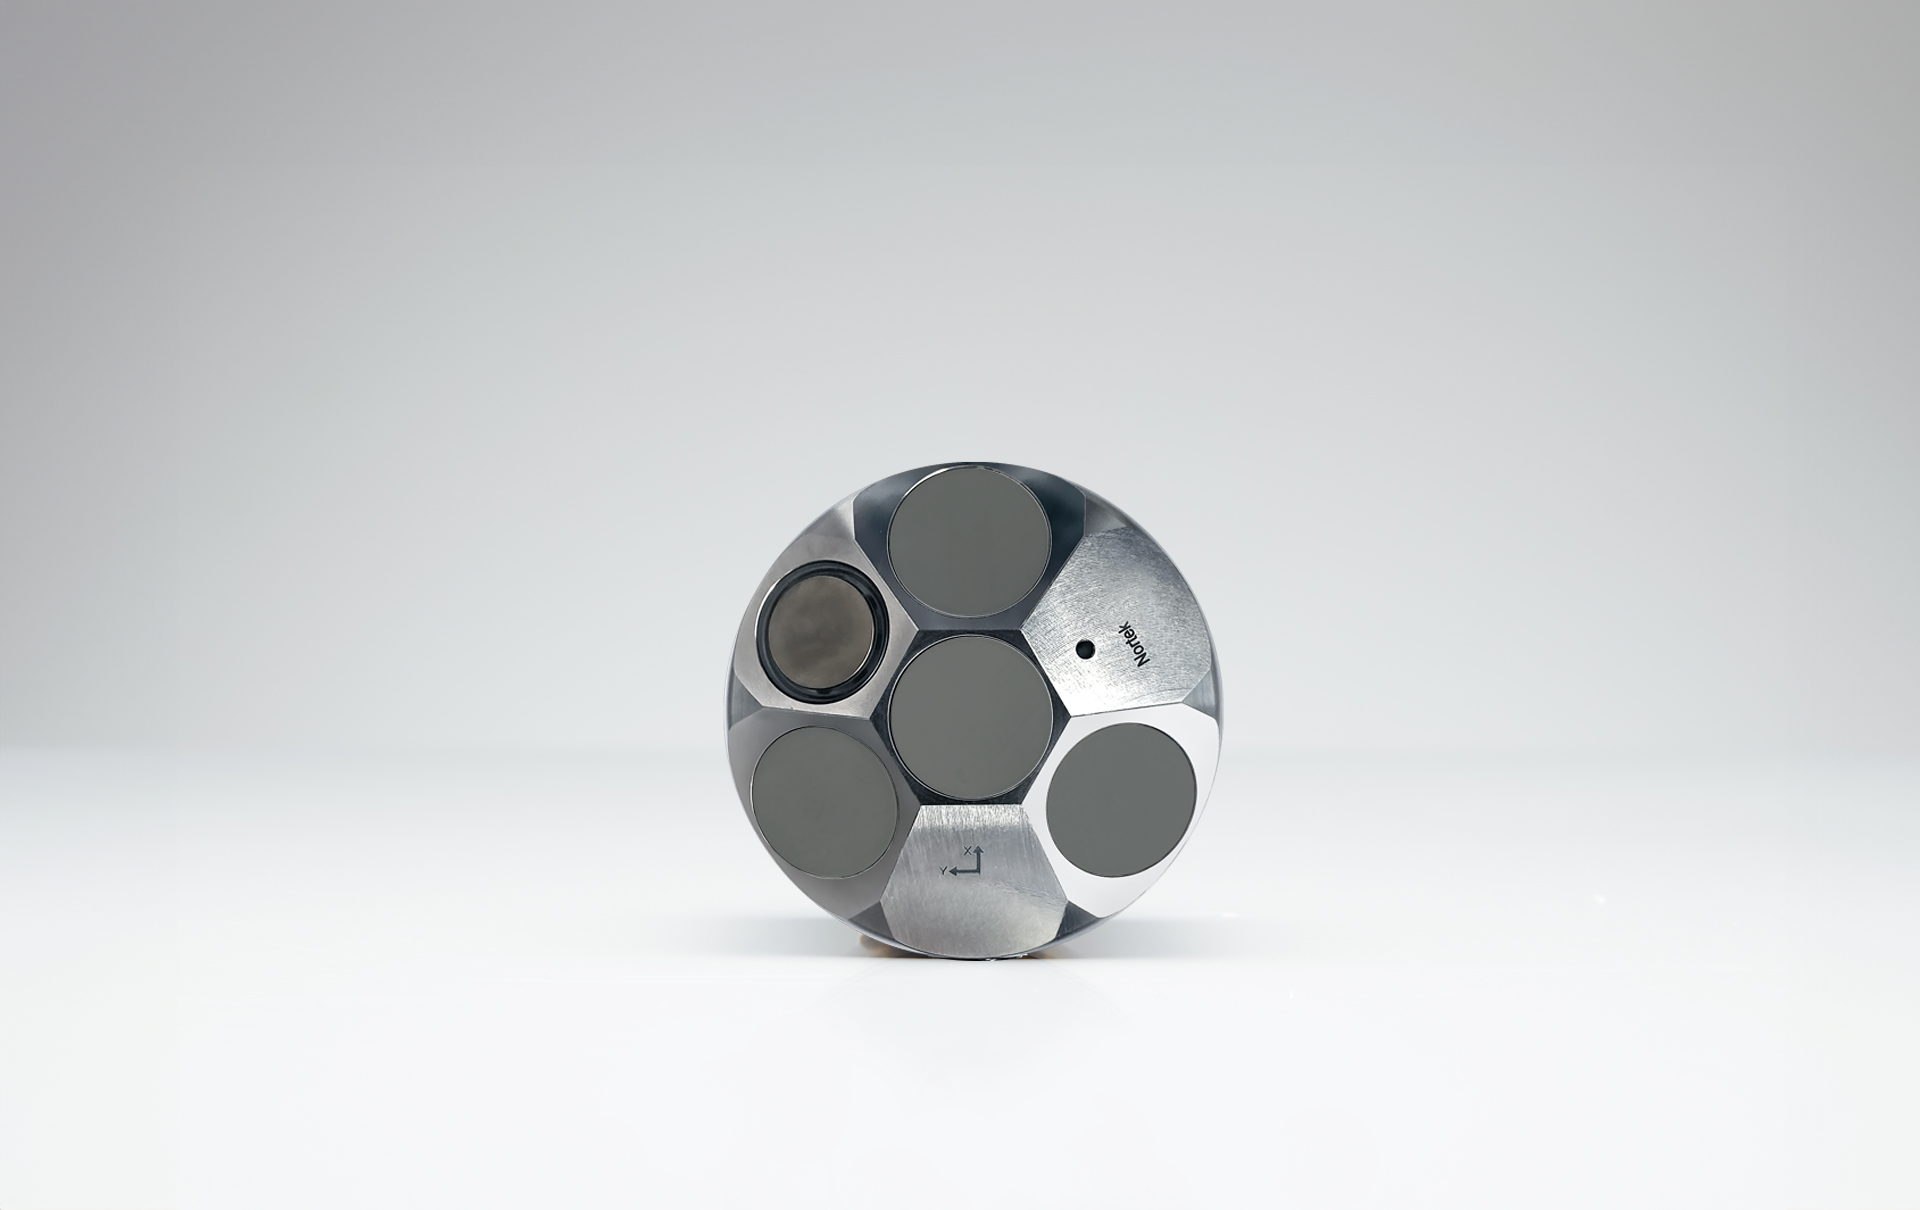
This is how it works: to increase the resolution of the echogram, the echosounder mode uses very short pings of 16 μs – 0.5 ms, which result in cell sizes of only 3 mm and larger. To decrease the sidelobe effect, we placed a center transducer on the ADCP that looks vertically up at the surface. There is no interference of other reflected sources. This means that you obtain clean data with high resolution all the way to the surface.
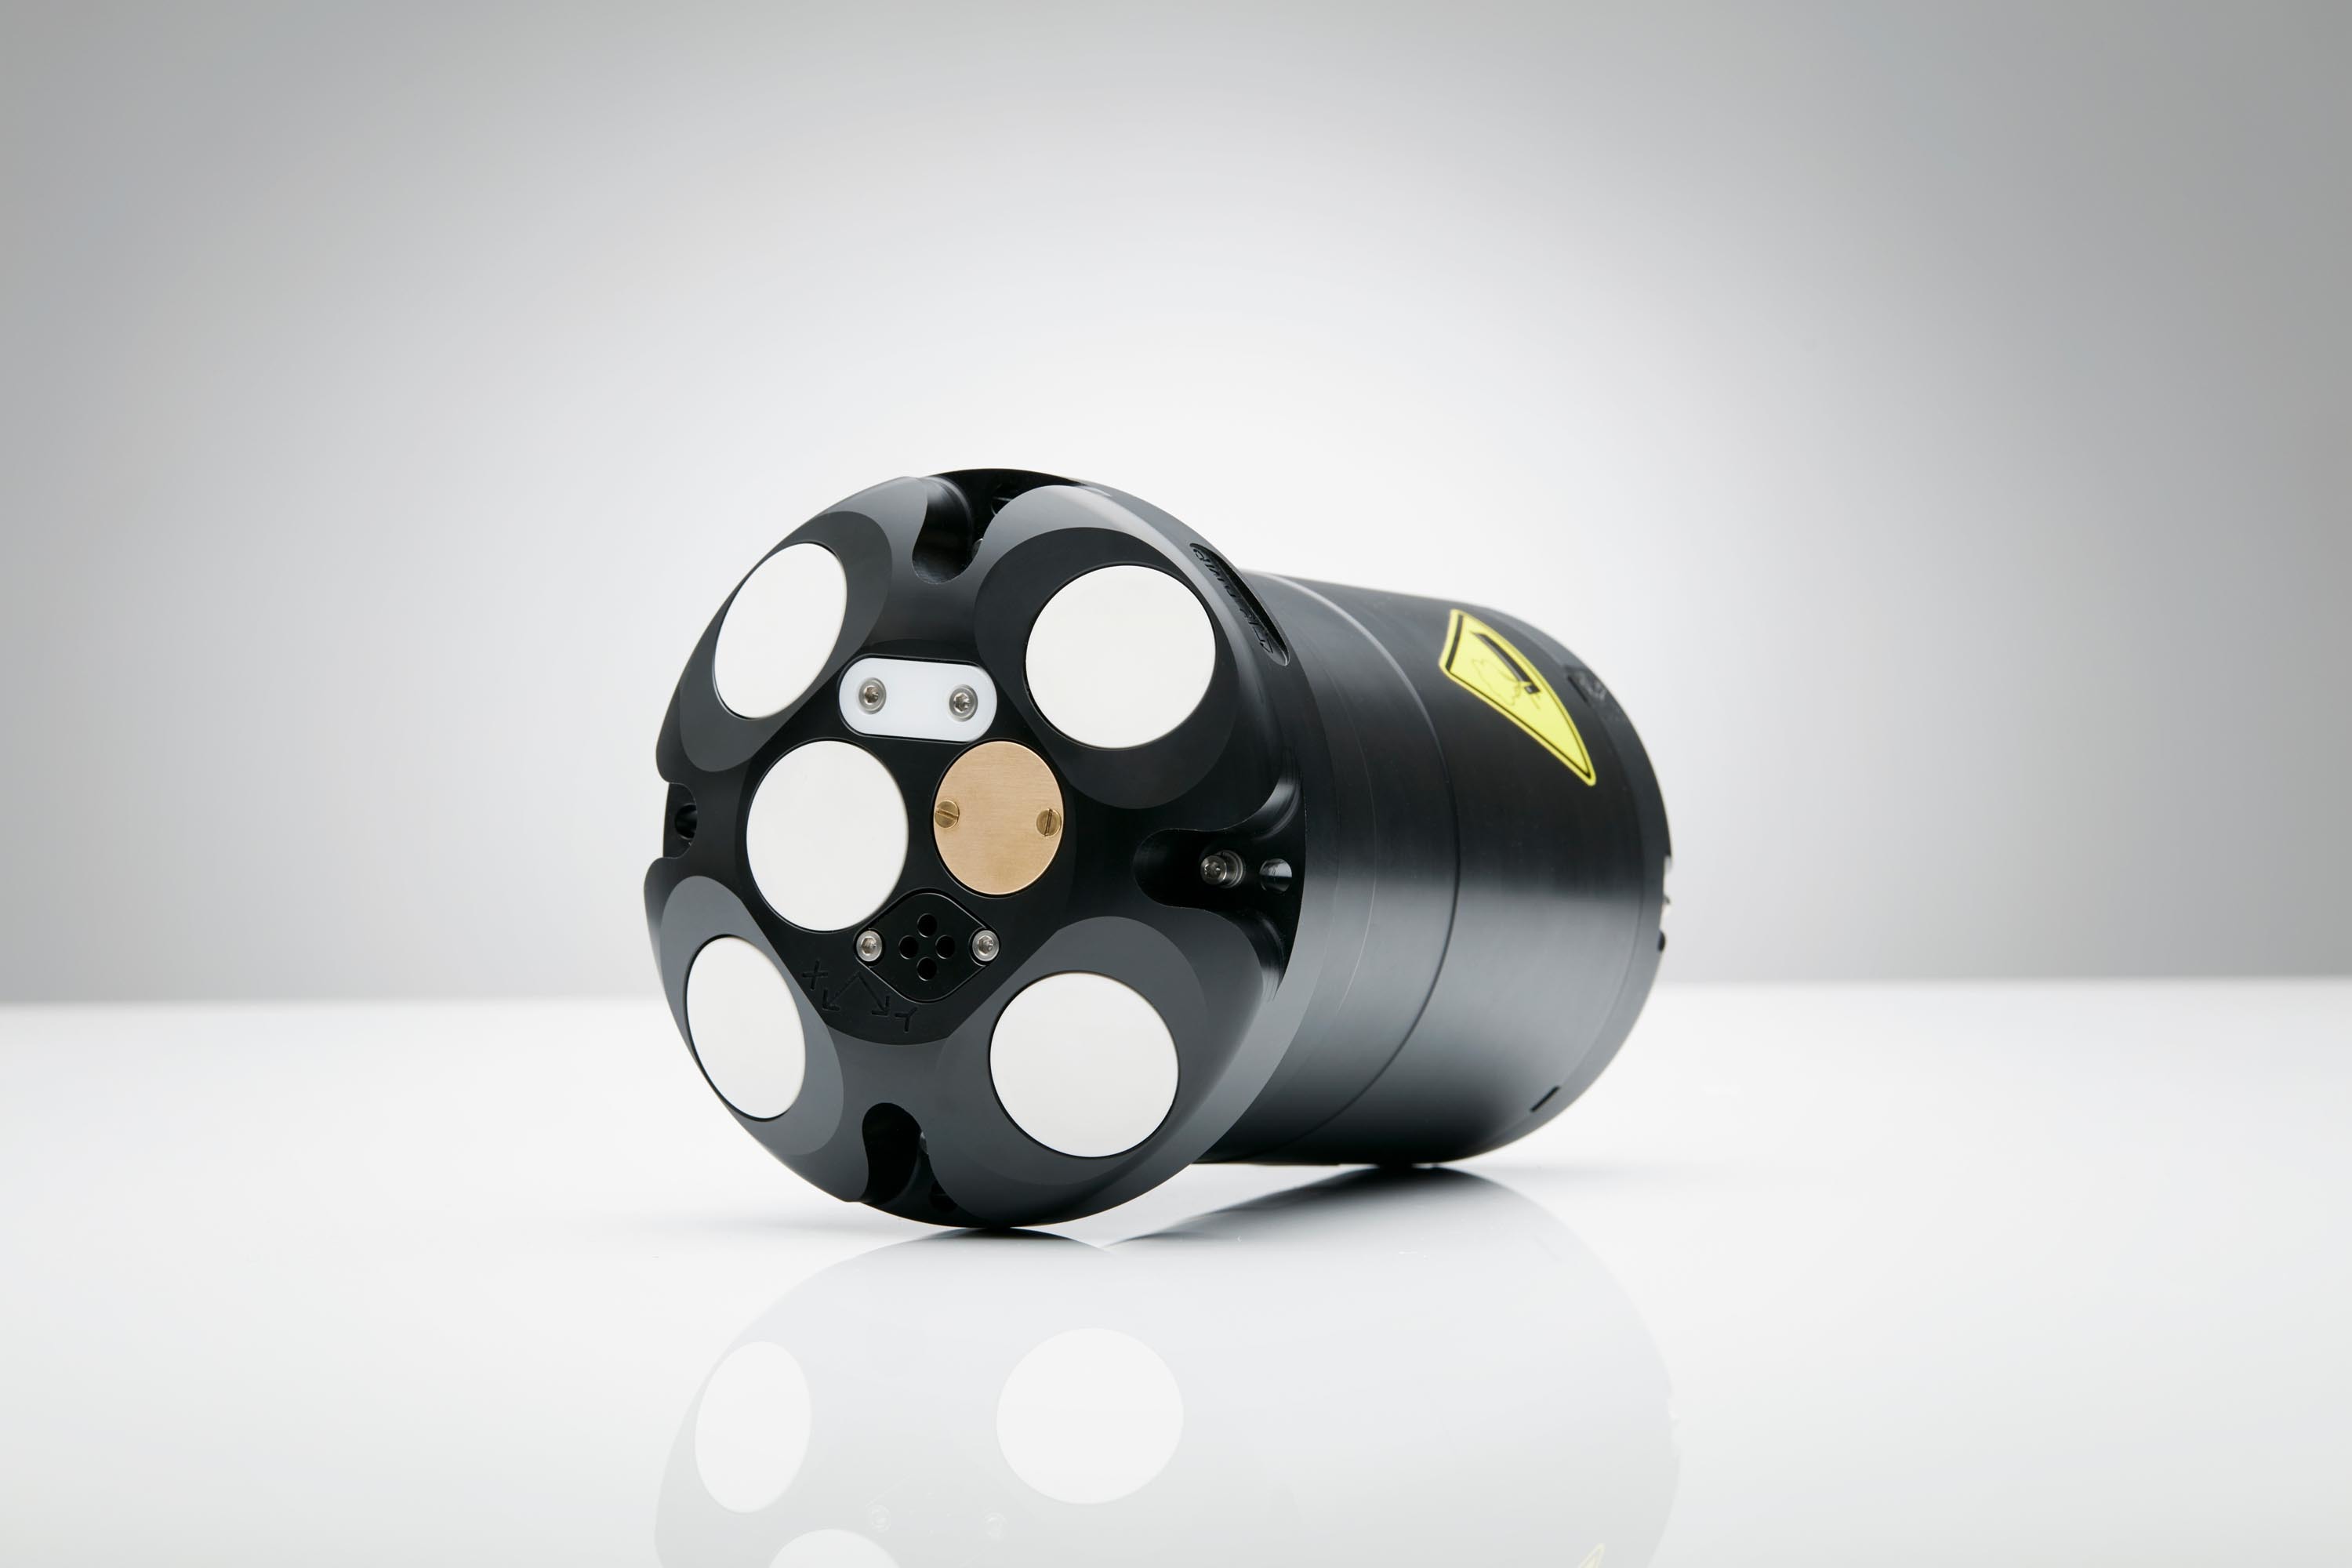
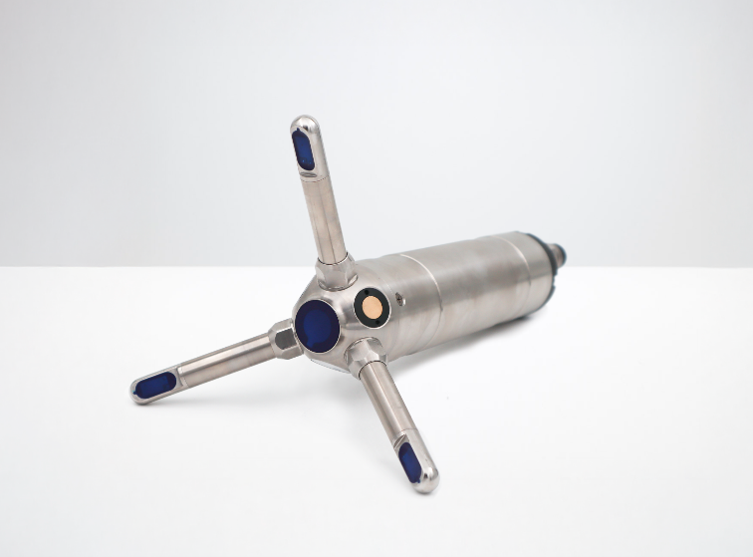
Nortek’s Signature1000 ADCP gives researchers the possibility to monitor sediment in detail.
Examples of data showing currents and backscatter
Nortek deployed a Signature1000 in a 29-hour measurement campaign in the Ems-Dollart estuary in the Netherlands. Currents were measured at 16 Hz and echosounder backscatter was measured at 4 Hz in alternating measurement schemes.
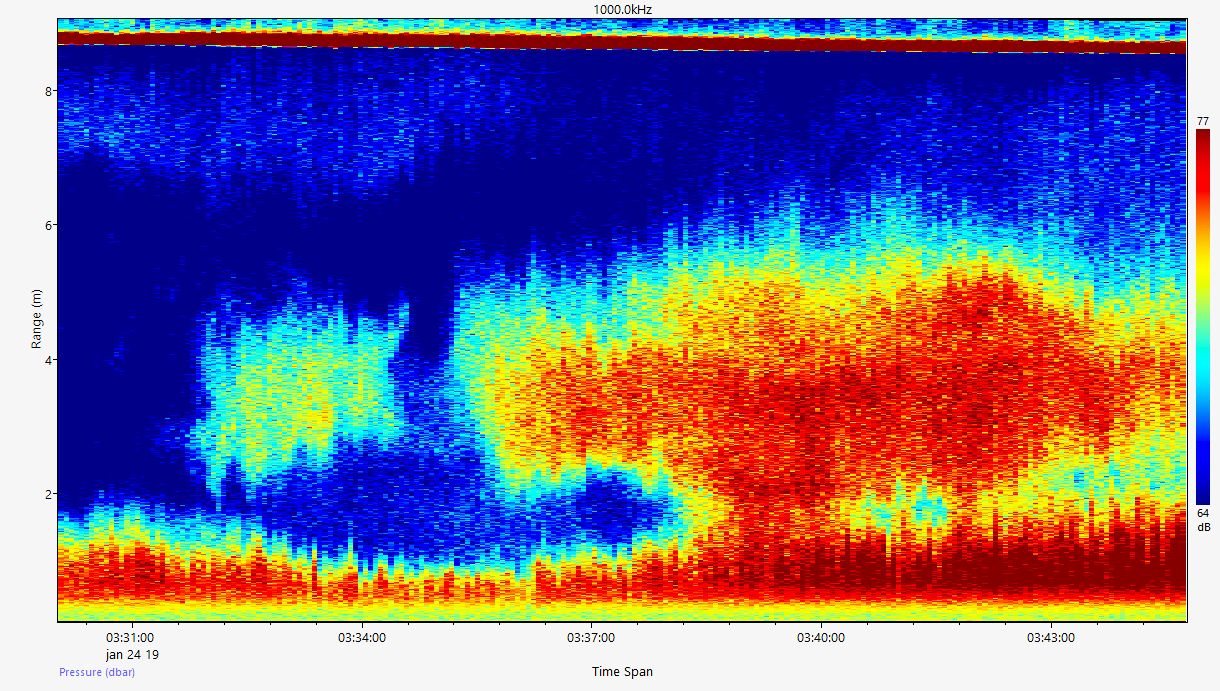
In the images below, the difference is shown between normal ADCP backscatter (left) and the echosounder (right), taken with the same instrument. The echosounder data was corrected for acoustic spreading and water absorption with the software package Ocean Contour.
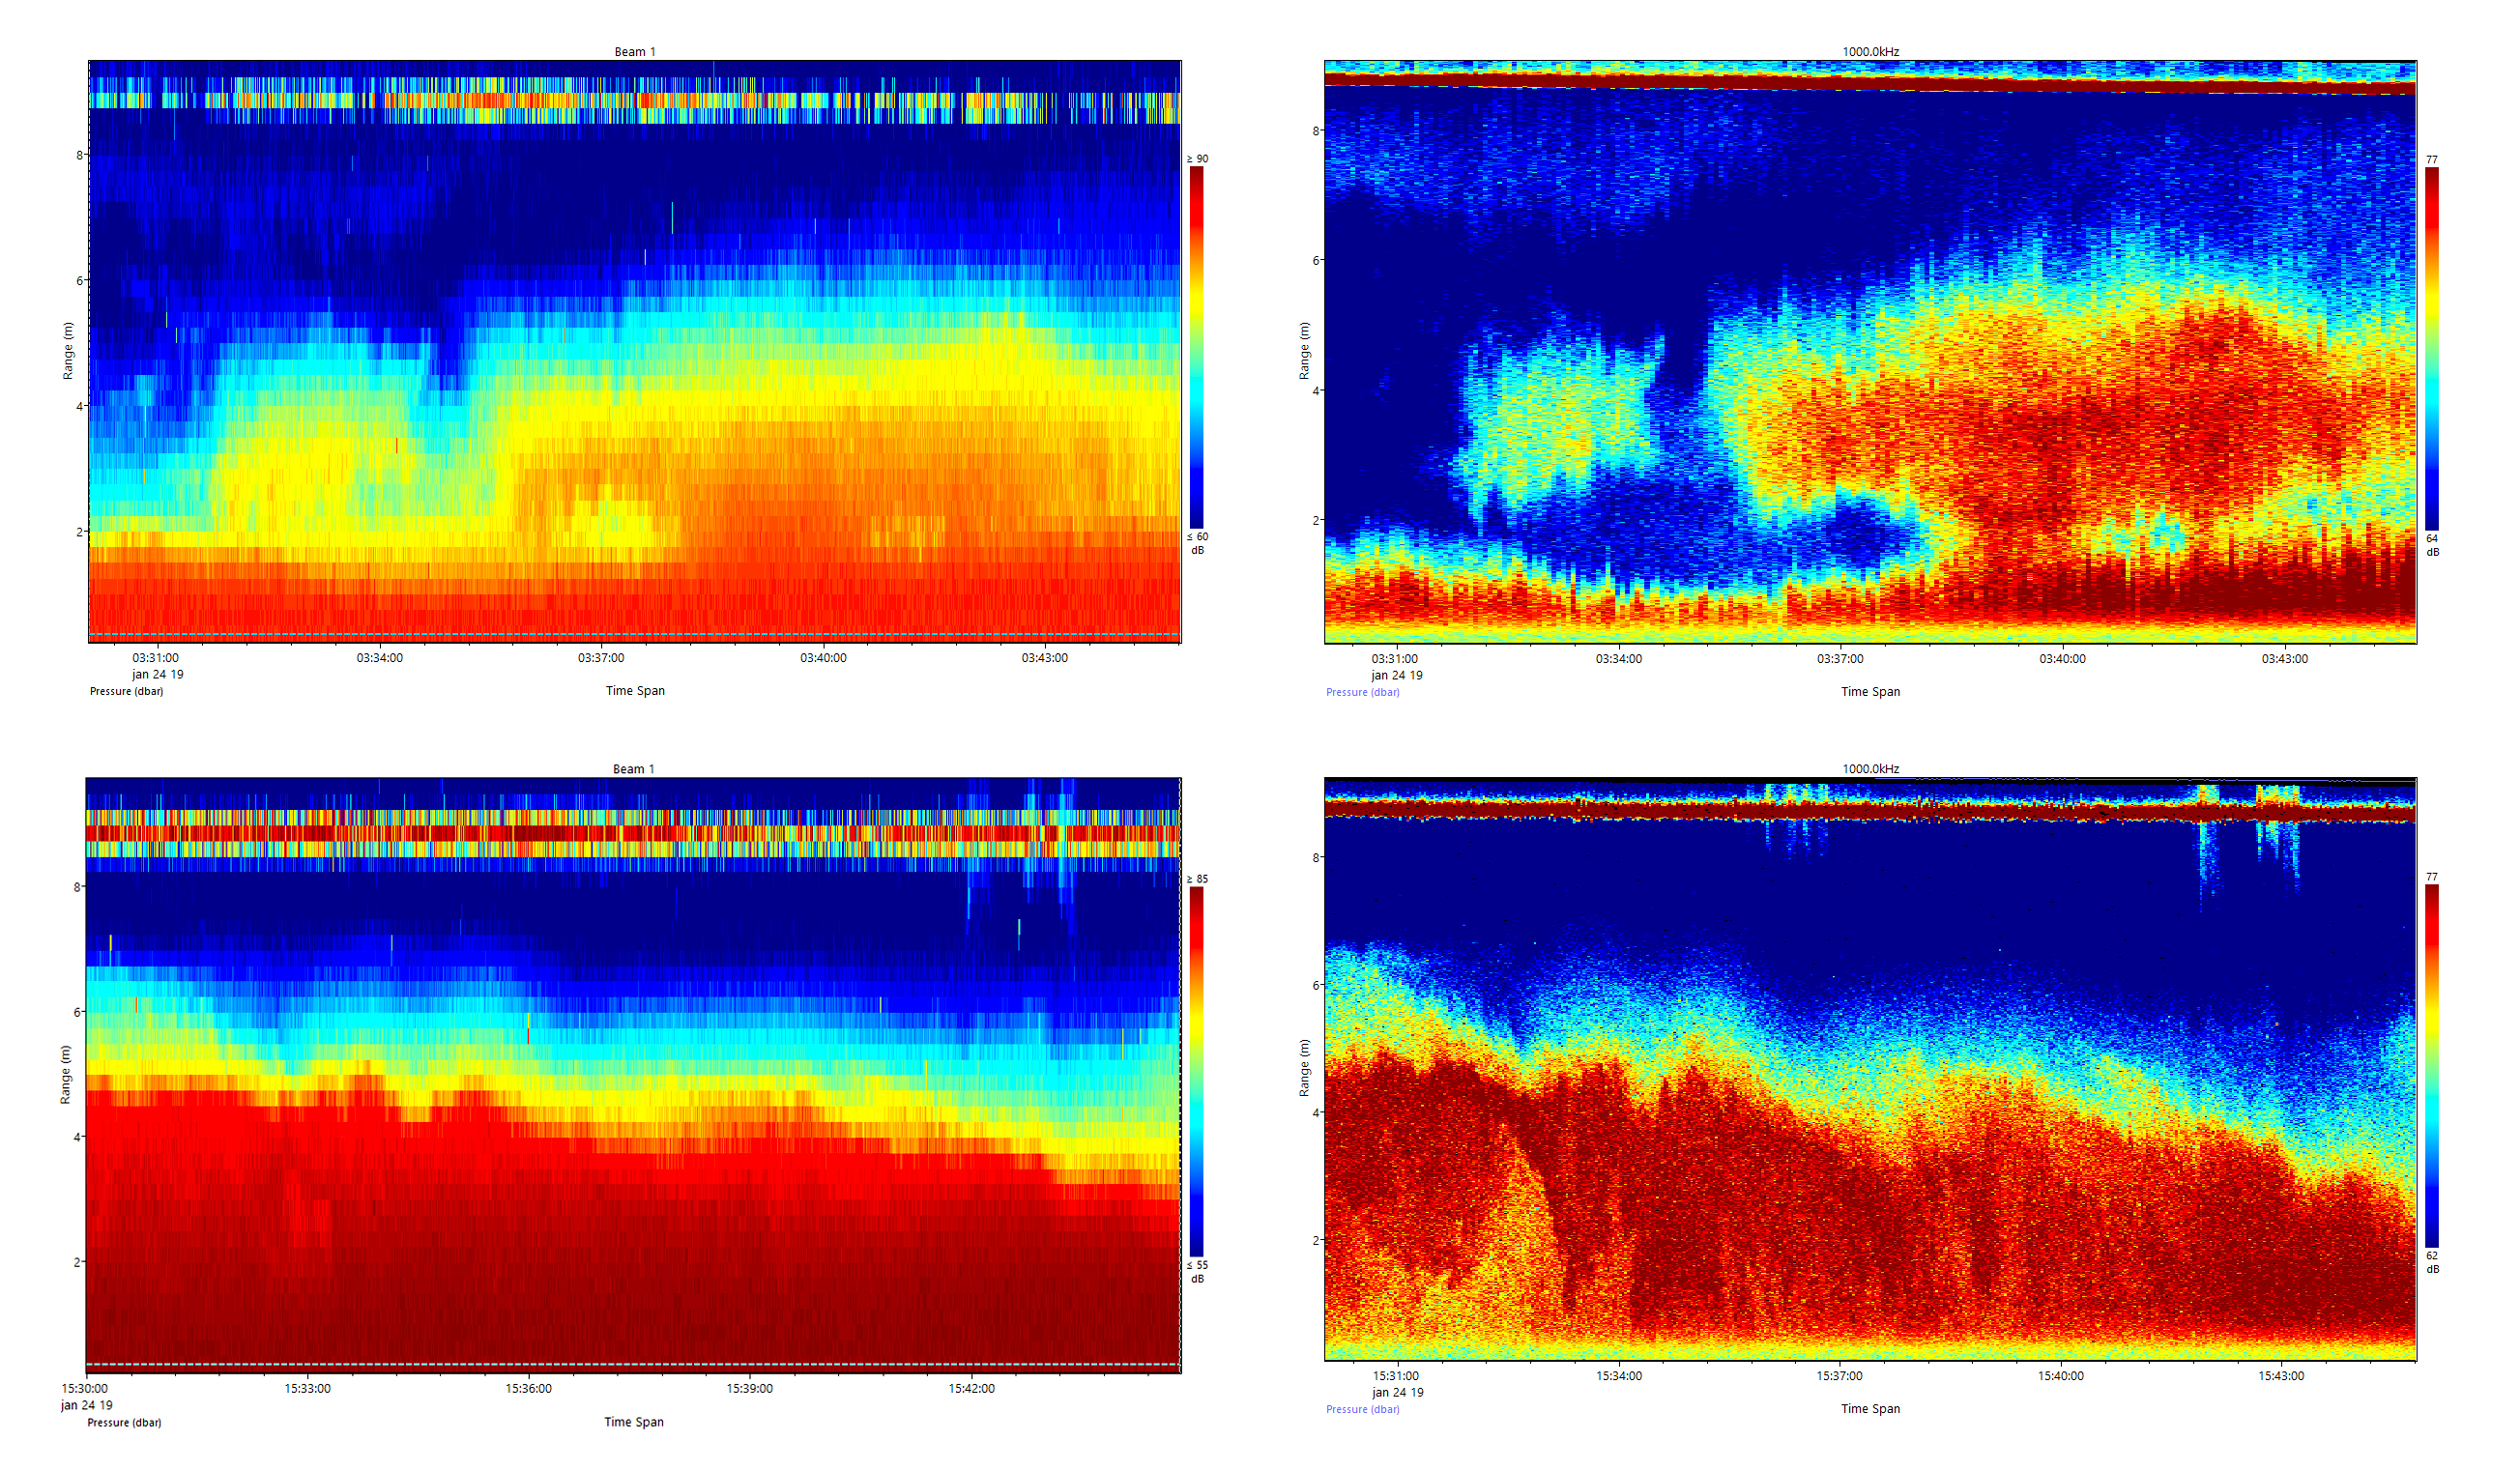
Regular backscatter (left) and echosounder data (right) from Signature1000. Both events are records of 15 minutes of data. The vertical resolution of the echosounder is 1 cm. It does not show any outliers near the surface. (For larger image)
The echosounder images show a lot more sediment structures. Detailed oscillations and nuances in backscatter intensity are picked up very well. Large-scale patterns correspond between the echosounder images and the regular ADCP backscatter. Sediment closer to the water surface is also recorded.
Multi-use ADCP
Combining detailed echograms and current measurements in one single instrument is completely new to the ADCP market. It gives researchers the possibility to monitor sediment in detail, while recording currents at the same time. Among other innovative features like the high sampling rate, HR mode and Ethernet communication, this makes the Signature1000 the scientific powerhouse of ADCPs.
By Rikke van der Grinten, Sales Engineer at Nortek.