How to get high-resolution echosounder data from water surface to seabed
- User stories
Synopsis
Challenge
Historically, attempts to gather combined echosounder and ADCP data resulted in data gaps and low-resolution echosounder data.
Solution
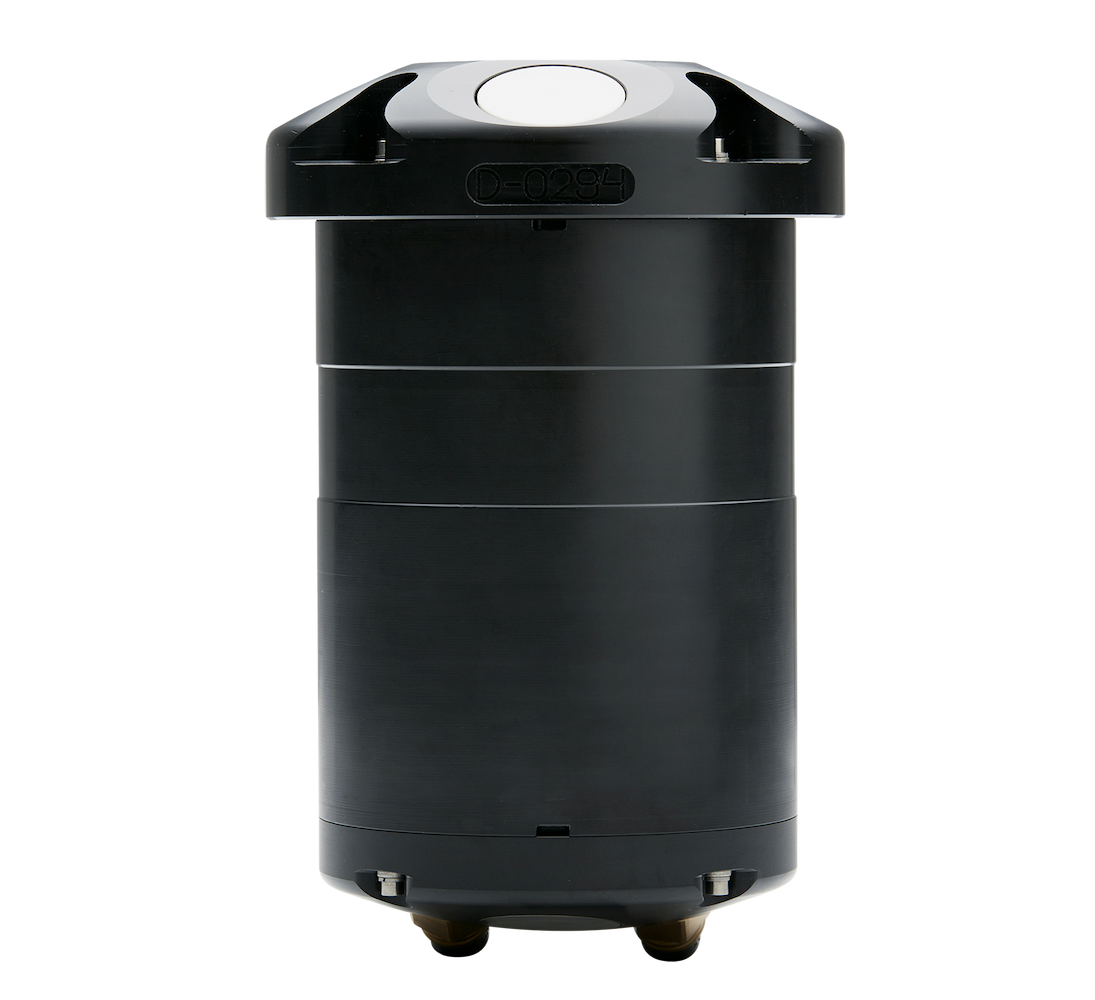
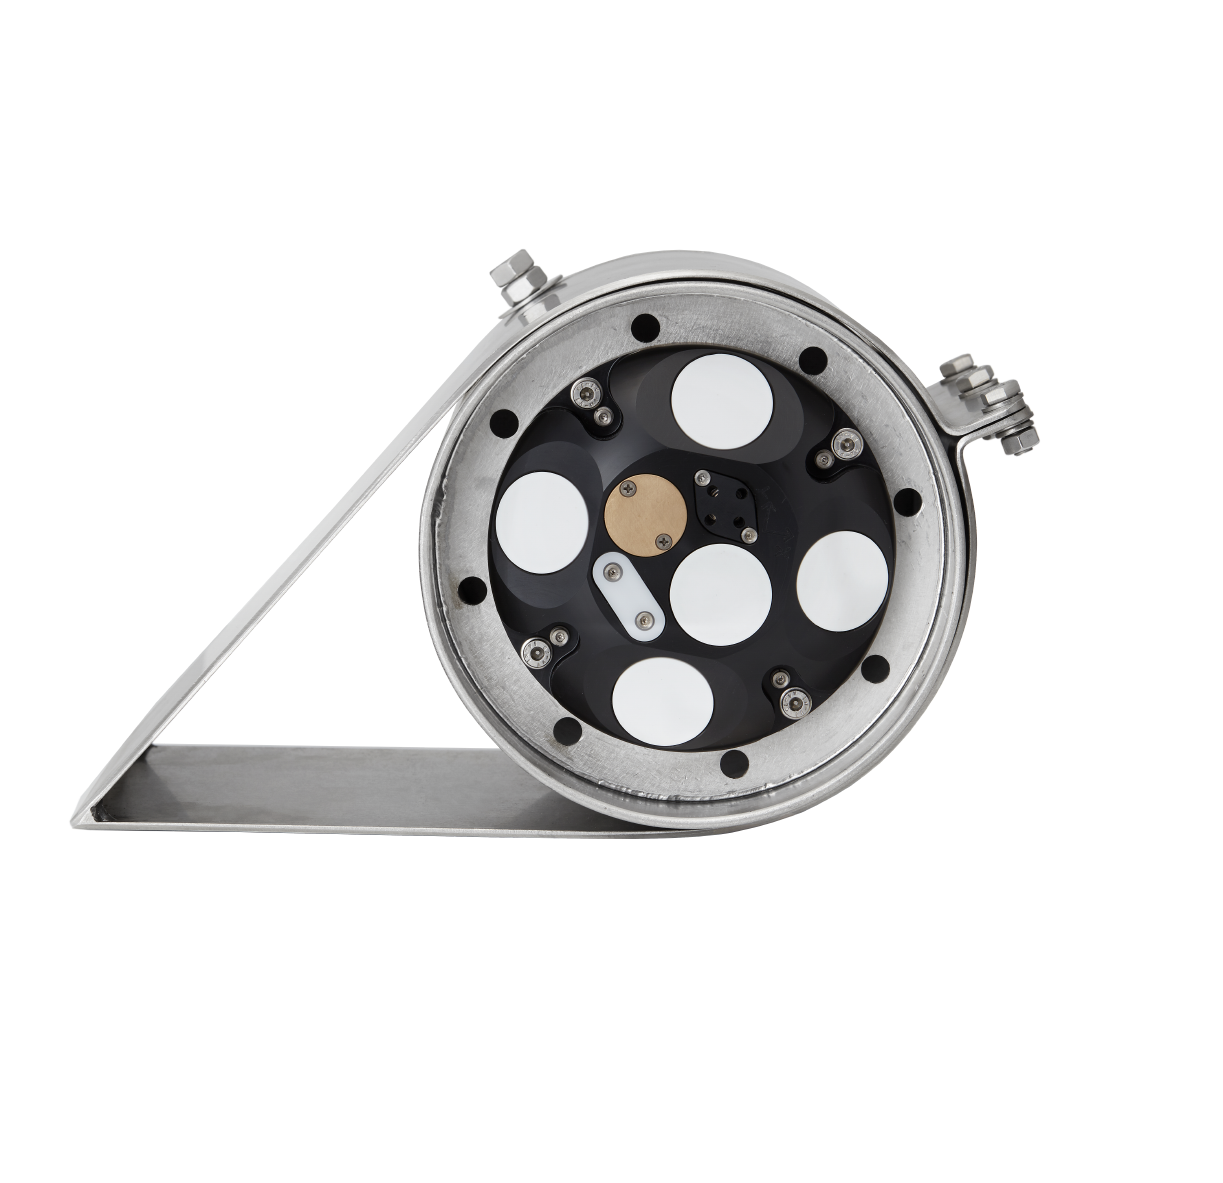
The VM Coastal's dedicated vertical echosounder beam aims to address these issues. Nortek worked with WaterProof BV to test the performance of this technology.
Benefit
These test campaigns proved the system's capability to measure echograms and currents, valuable data for dredging, erosion studies, and many other research projects.
Echograms, recordings of depth or distance under water made by an echosounder, provide a means of tracking geomorphic and biological features over vast spatial and temporal domains.
Addressing the shortcomings of ADCP and echosounder technology
When echograms are coupled with current velocity data from an acoustic Doppler current profiler (ADCP), water flux rates and flux trajectories can be estimated.
However, pairing ADCP and echosounder technology has historically been problematic. Combining these two technologies has yielded echograms with low resolution, limited dynamic range and data gaps near the seabed because of competing requirements for velocity output. Nortek’s vessel-mounted ADCP, the VM Coastal, was designed to address these limitations via a fifth, vertical, single-beam echosounder that occupies dedicated pings within the velocity data stream.
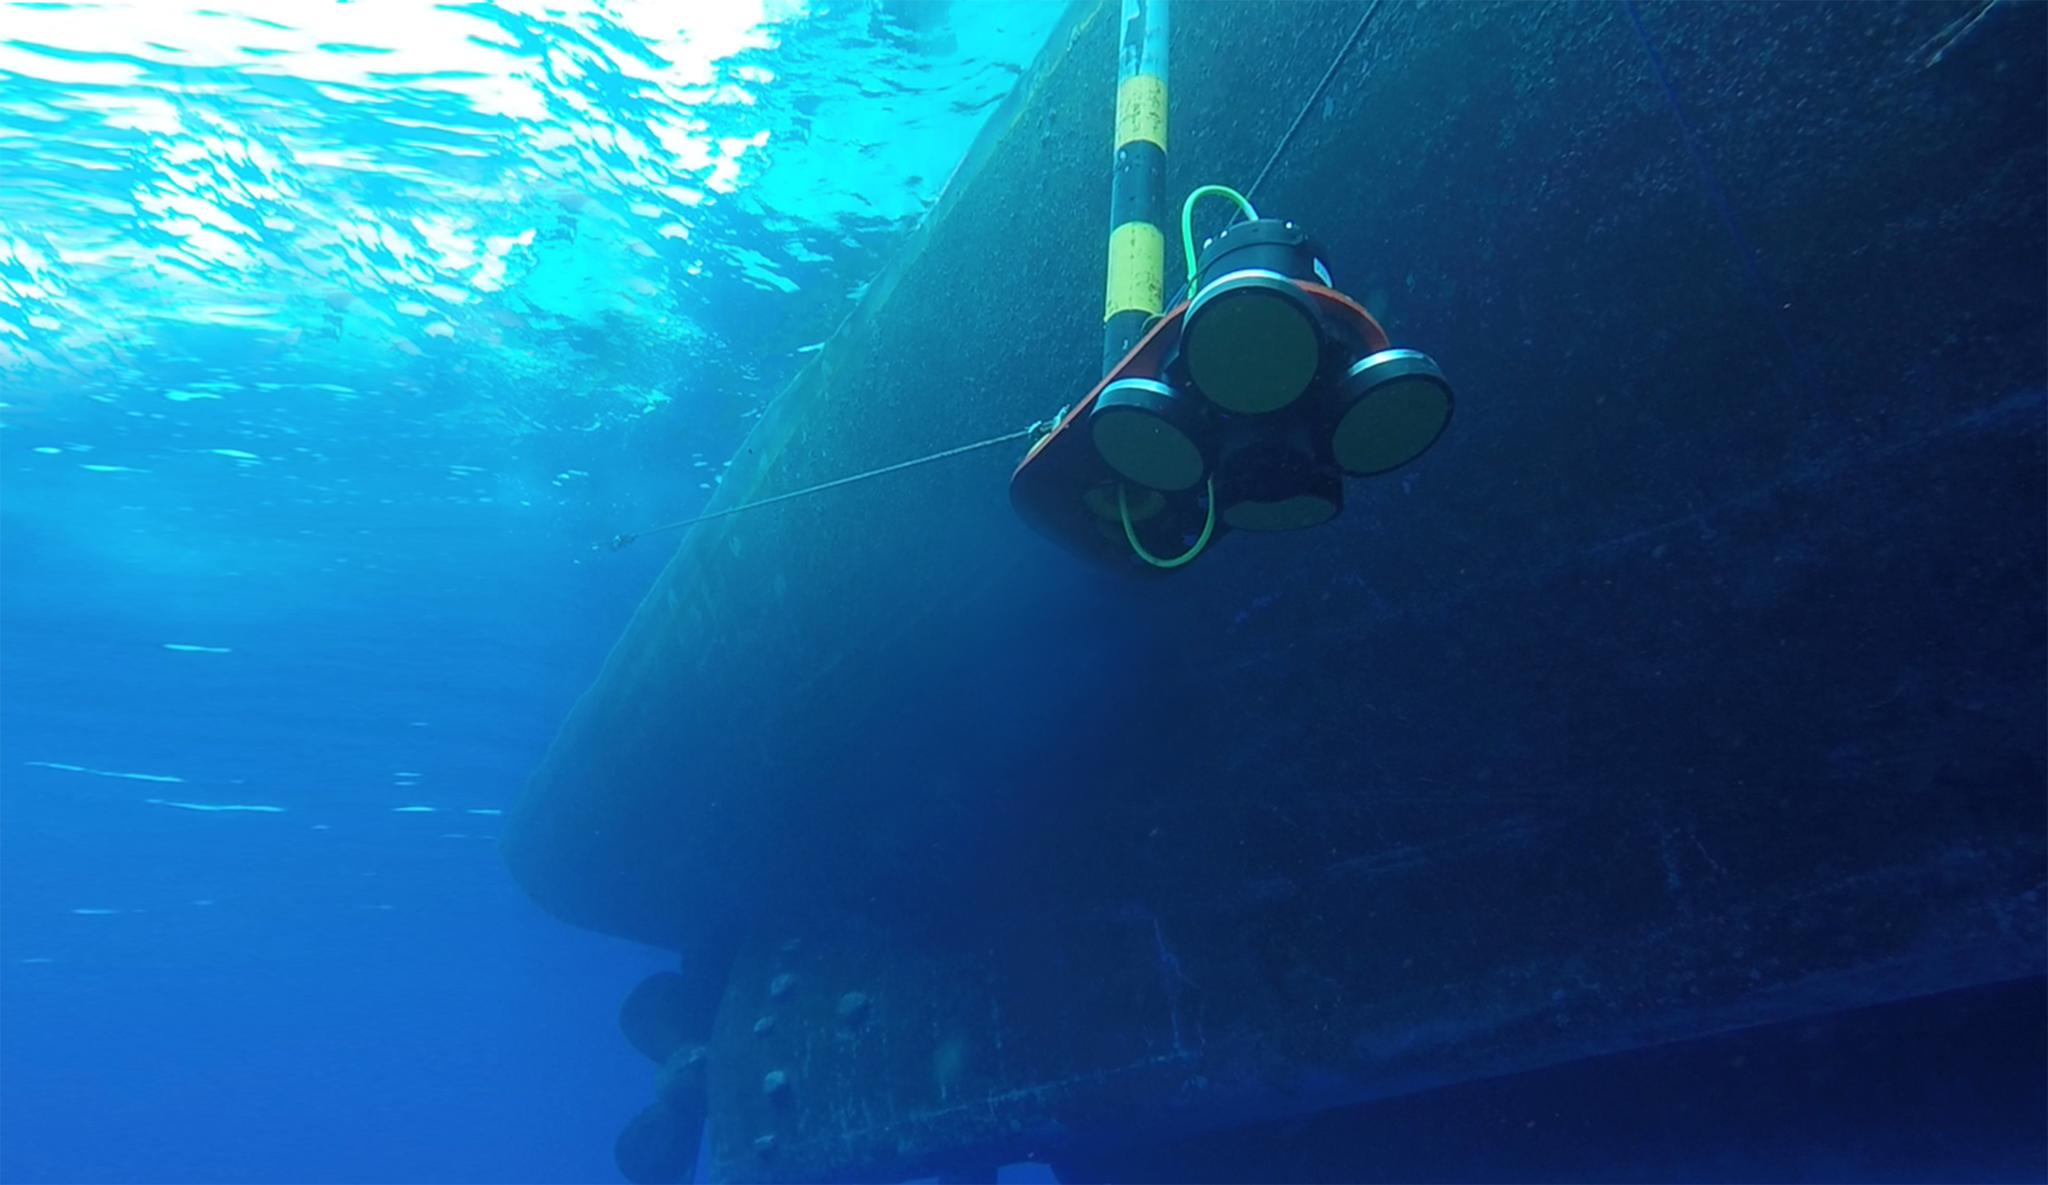
Monitoring all the way up to the water surface is not possible with commercially available vessel-mounted ADCPs due to limitations in the near field and blanking regions. Therefore, Nortek’s vessel-mounted system combines data with output from a second bottom-mounted Signature 1000 ADCP. This enables users to see water-column dynamics from the seabed all the way to the sea surface – and this at a high spatial and temporal resolution as well as at broader scales.
Successfully combining ADCP and echosounder technology
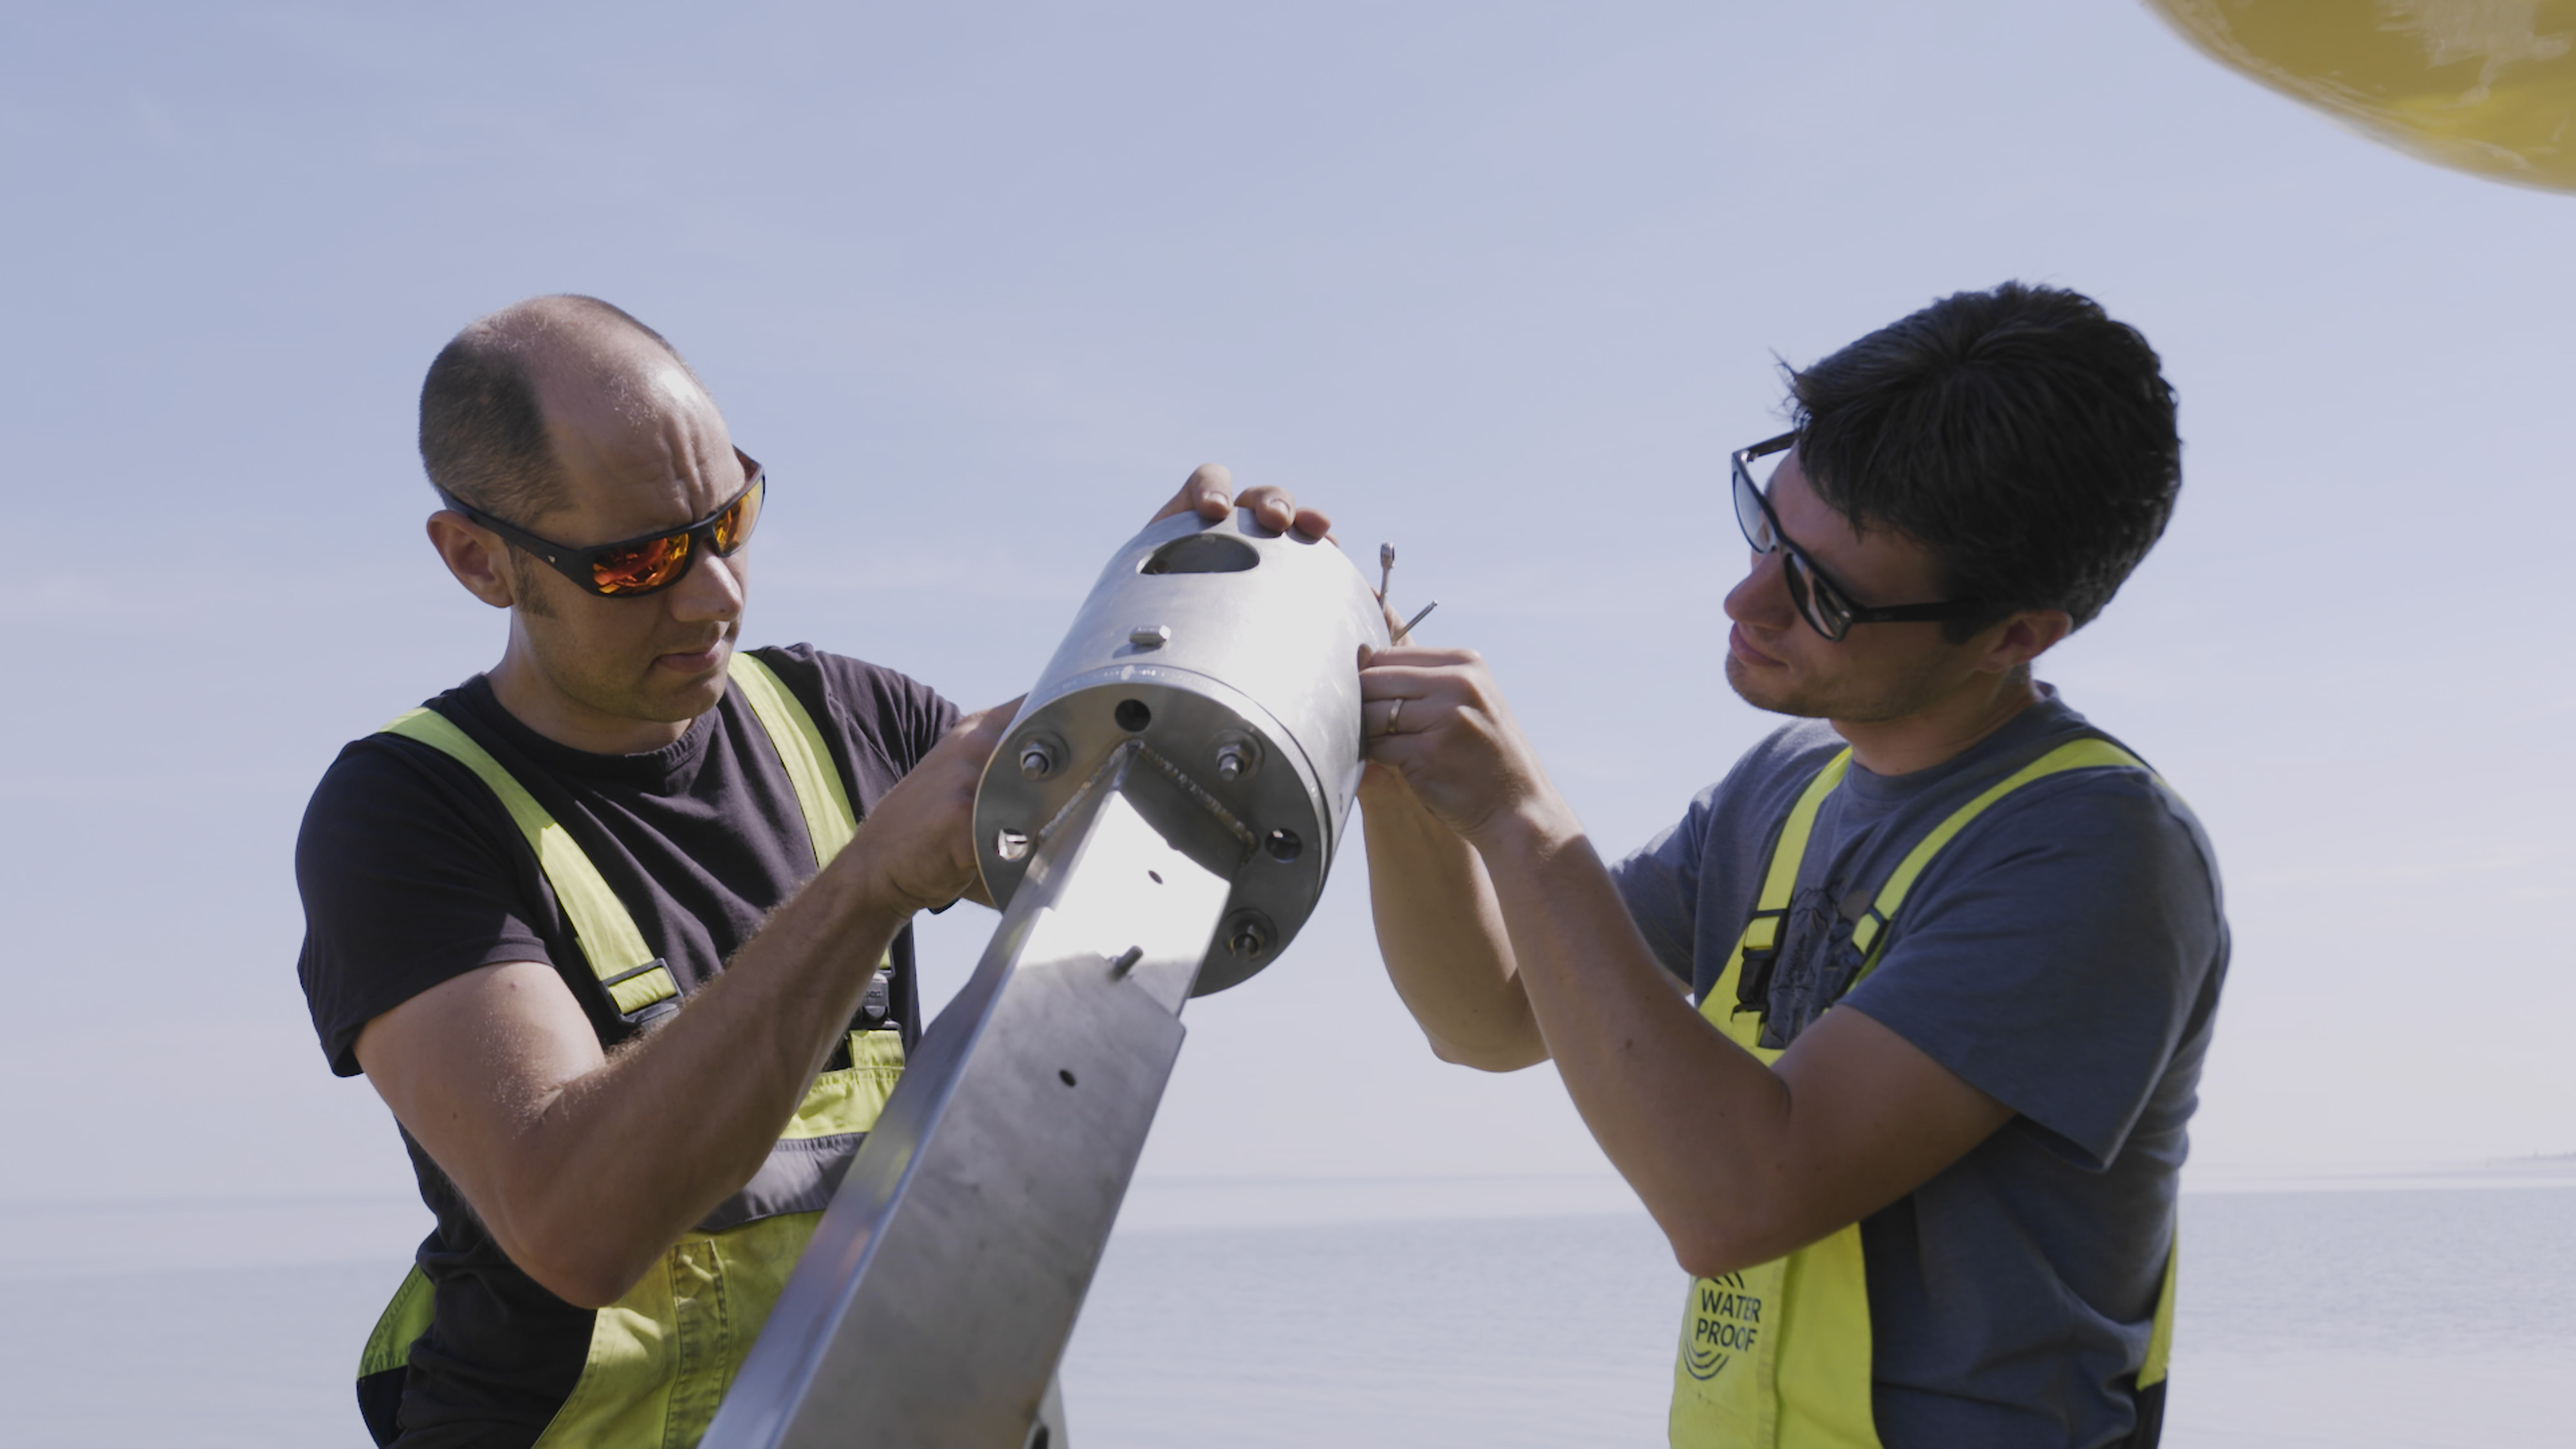
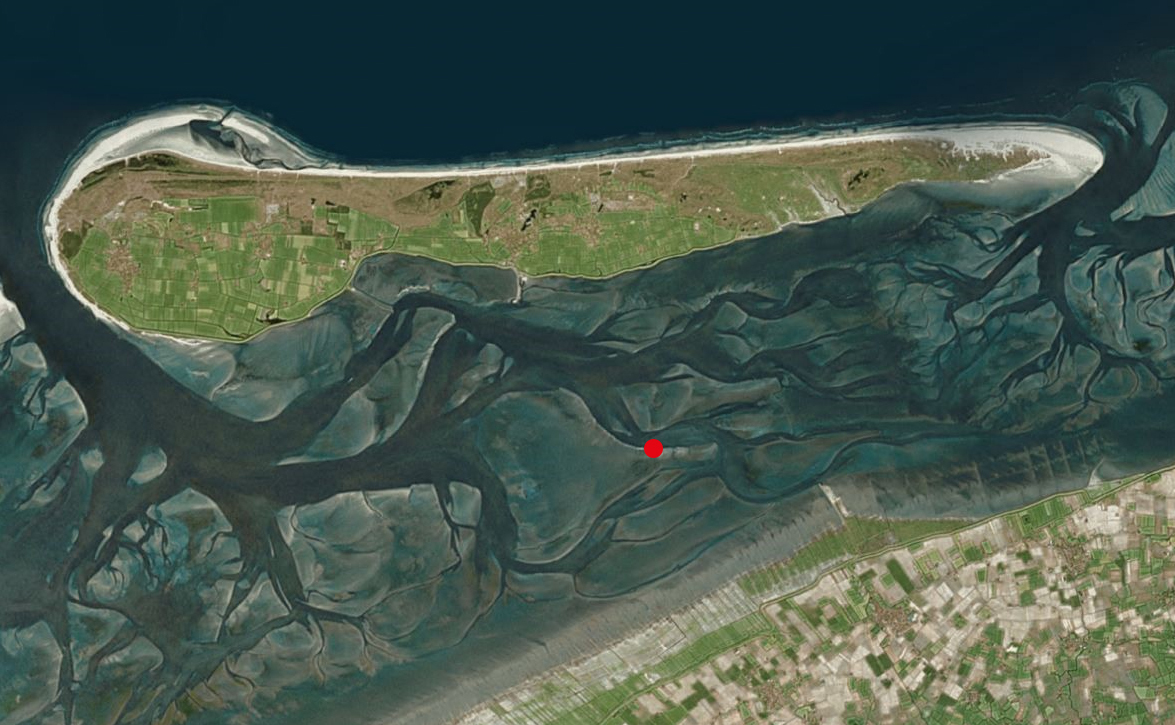
Nortek joined forces with WaterProof BV in the Netherlands to test the performance of this novel technology. WaterProof deployed a vessel-mounted Signature 1000 ADCP in conjunction with water sampling in a tidal channel in the autumn of 2019 in the Wadden Sea in the Netherlands. The sampled region, shown in Figure 5, is characterized by tidal currents, dredging activities, mud flats, ferry transport and shallow waters, making for a dynamic sampling area. The test was carried out by executing two different measurement campaigns.
The selected data subset from the first campaign was obtained over 13 hours to cover a full tidal cycle. Water samples were taken each half hour at three different water depths and analyzed for mud and sand content. A vessel-mounted Signature 1000 echosounder was deployed with 0.05 m cell size and 2 Hz sampling rate in pulse compression mode. The echosounder backscatter was corrected for losses, and relative volume backscatter reflections under the altimeter-derived seabed delineation were suppressed.
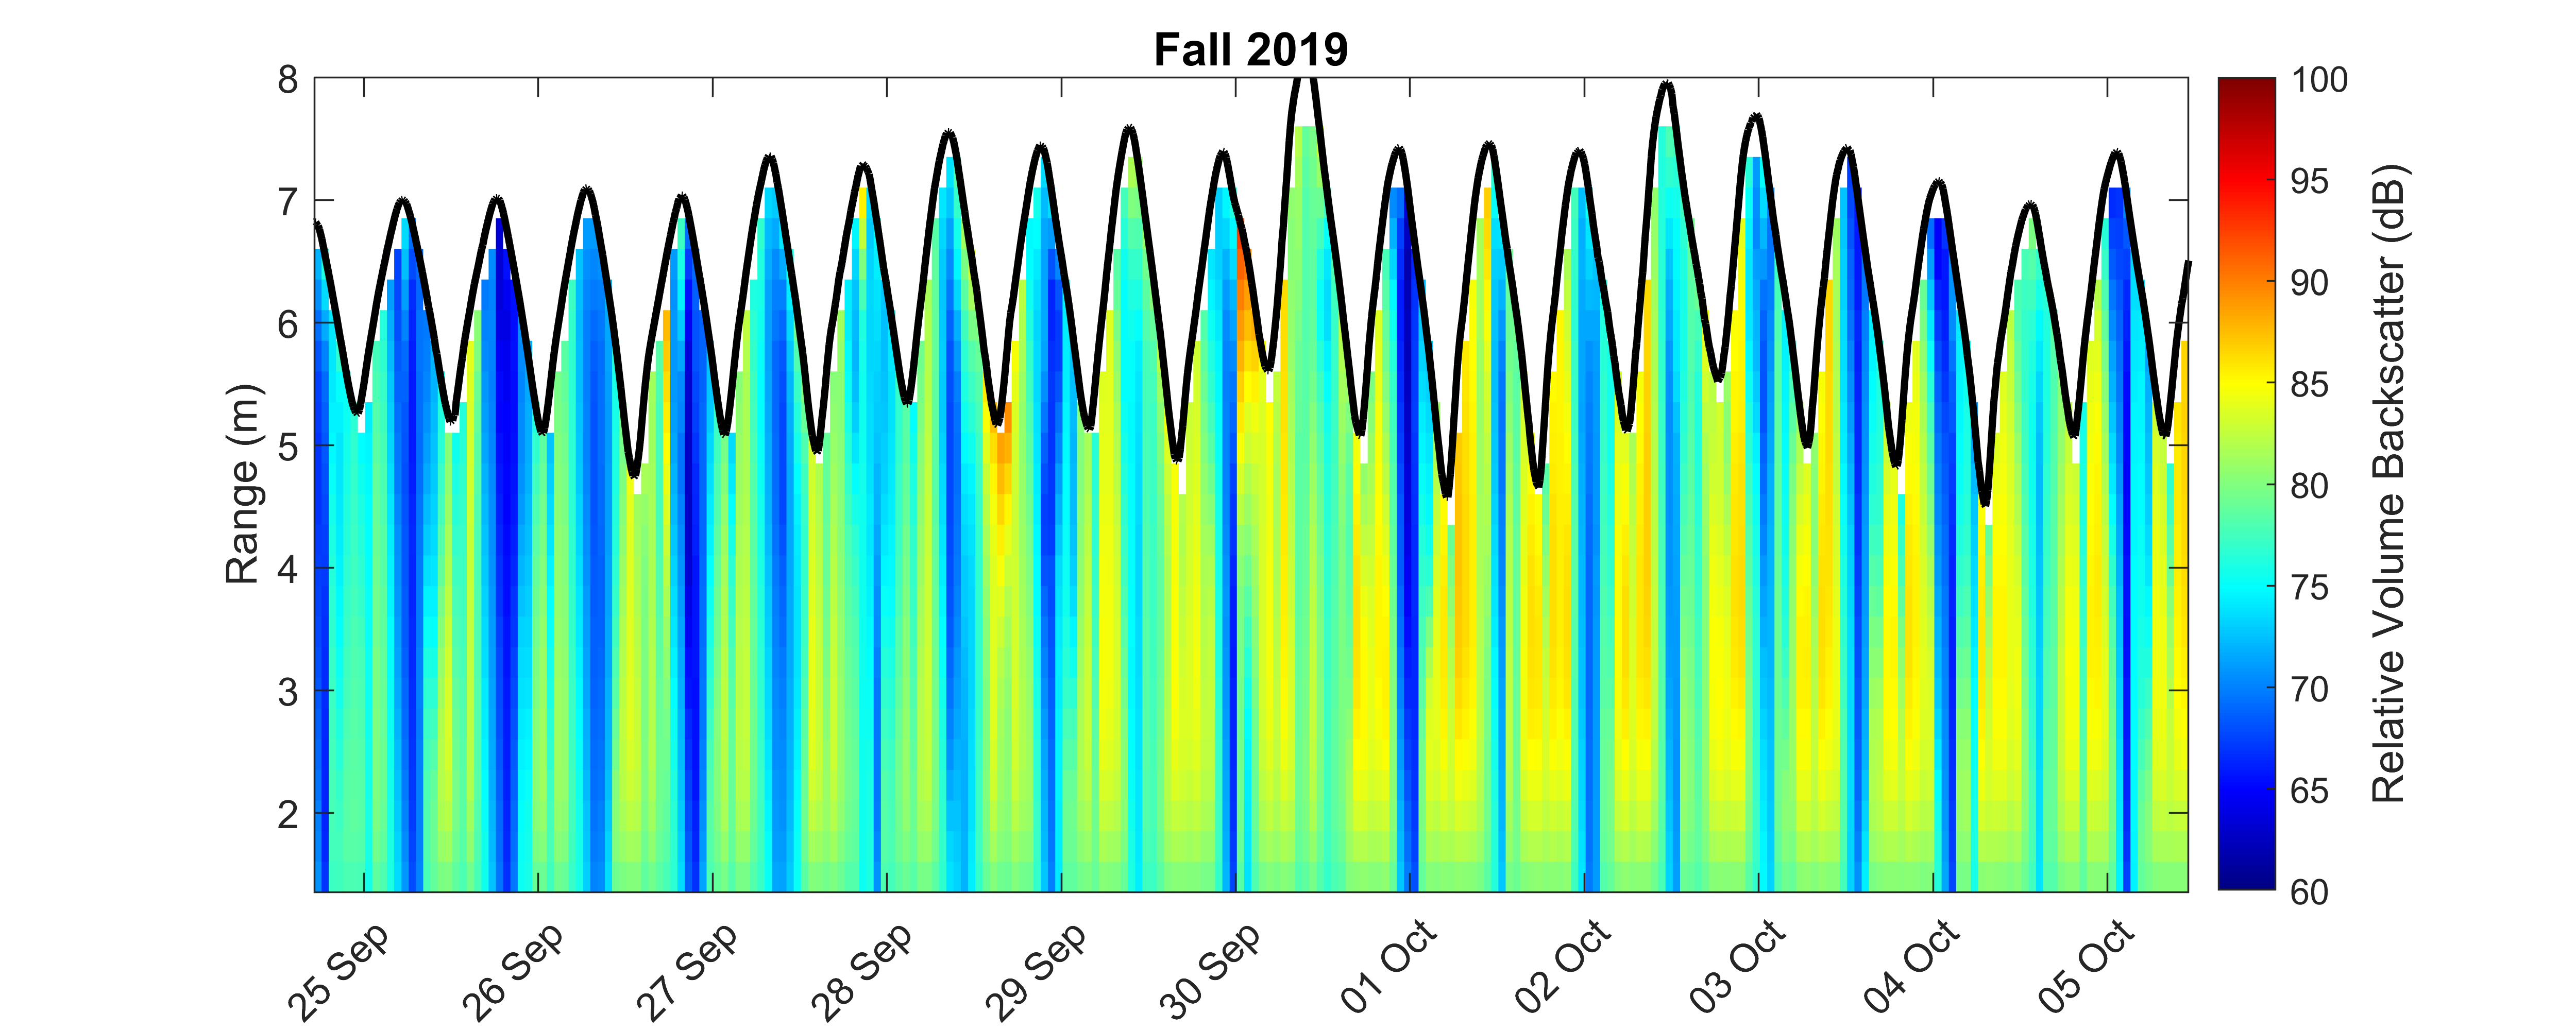
During a second, multi-day campaign, a bottom-mounted Signature 1000 captured data up to the sea surface. The longer timescale of this data set reflects tidal dynamics that are visible in the altimeter-derived sea surface and in oscillations in relative volume backscatter and velocity data. A subset of this data representing approximately ten days is presented below (Figures 3 and 4).
A high-resolution echogram from the vessel-mounted Signature 1000 is presented here (Figure 1).
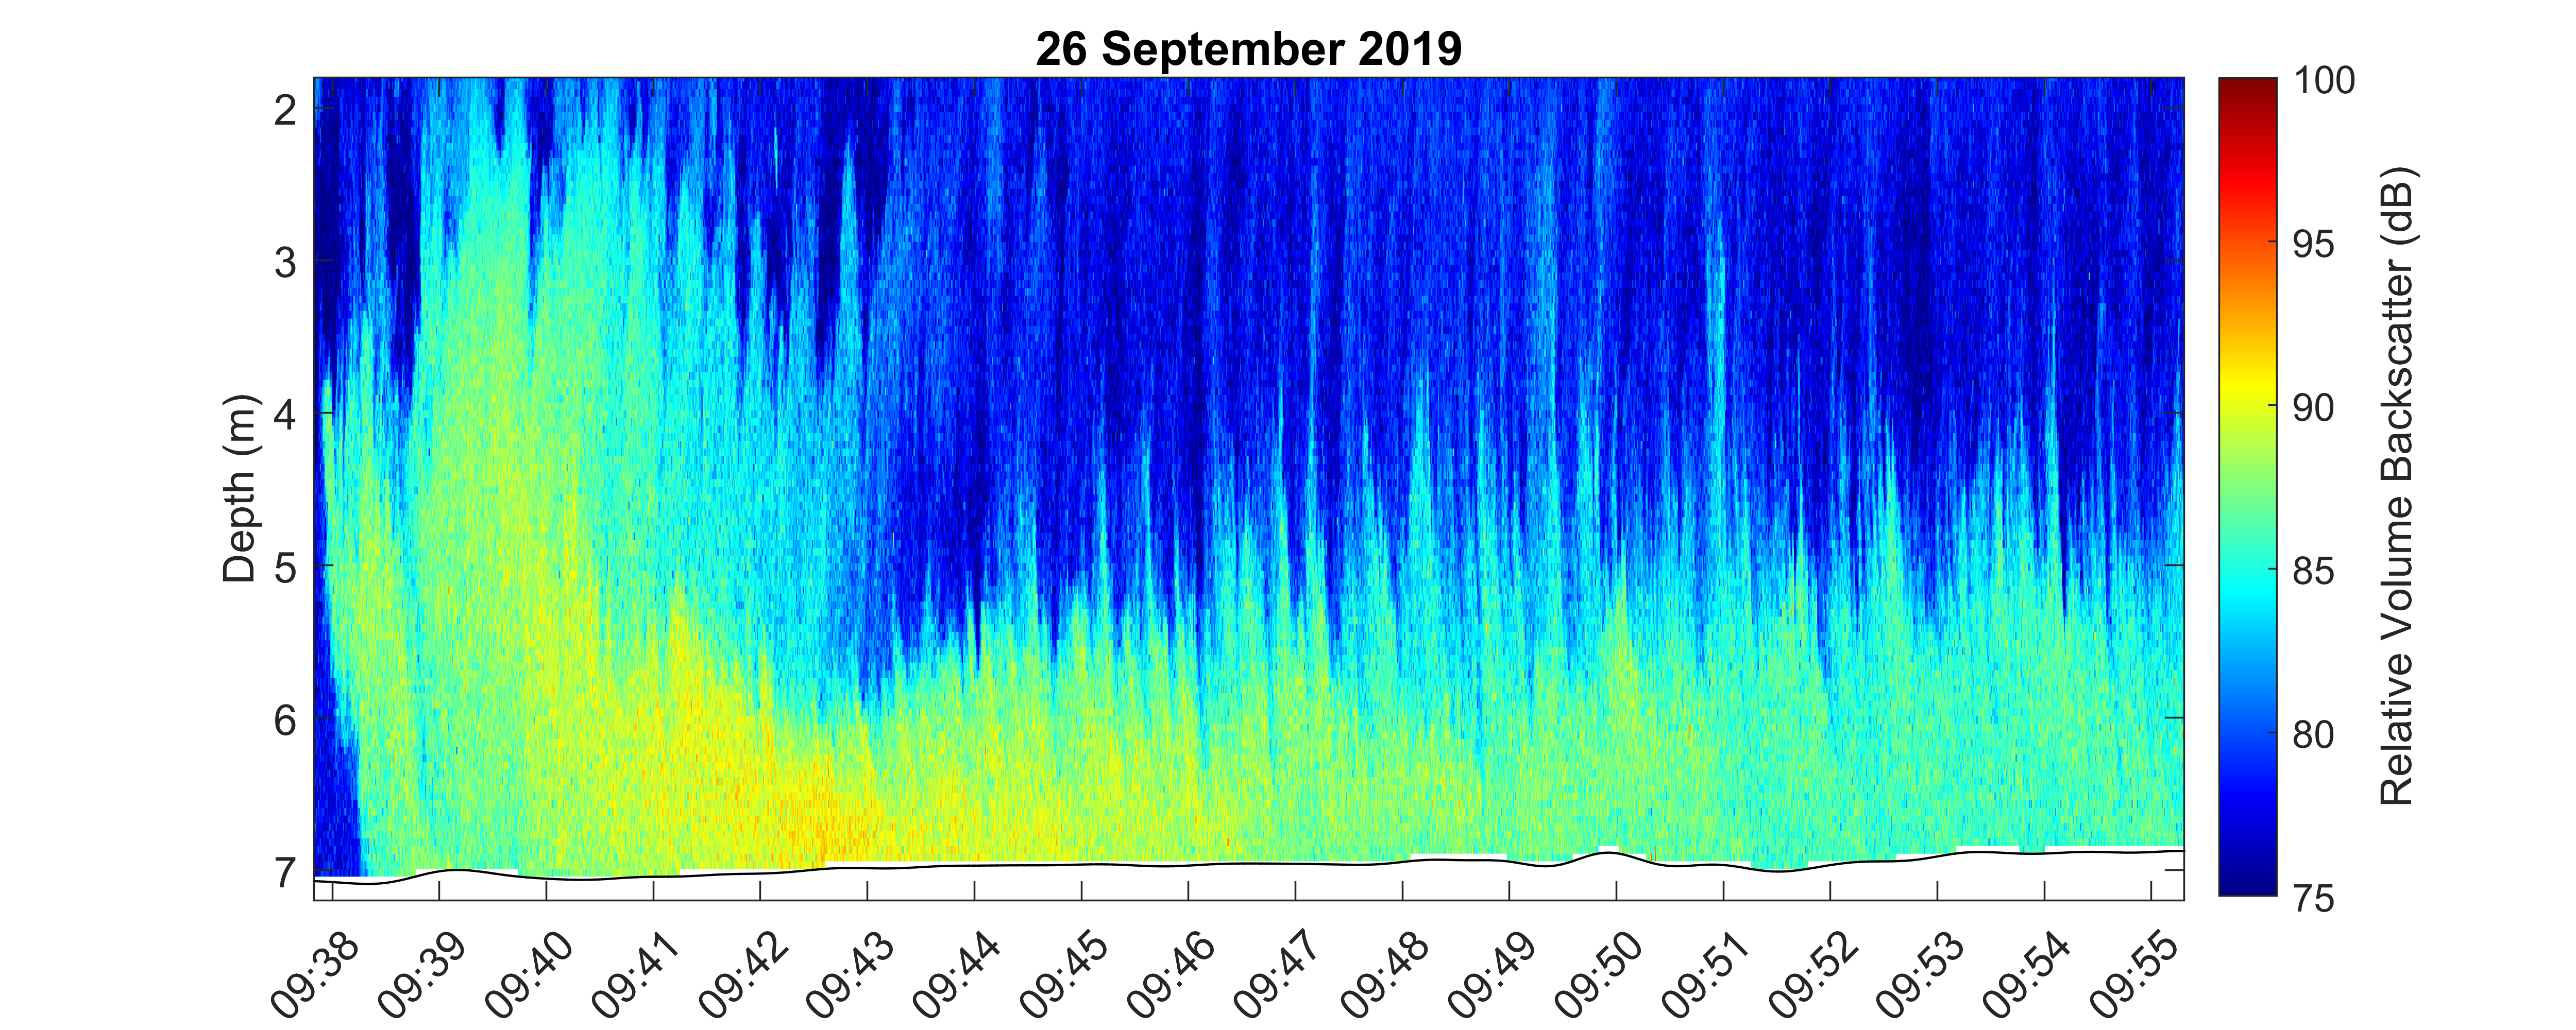
The echogram reveals coherent patterns with variability in the vertical and horizontal domains down to the seabed. Higher echogram intensity near the bed indicates greater suspended sediment concentrations (SSC) deeper in the water column.
Figure 2 shows water sample depth and mud suspended sediment concentrations over a 13-hour period. Higher suspended sediment concentrations reside near the bed during the same time period as the 30-minute snapshot shown in Figure 1.
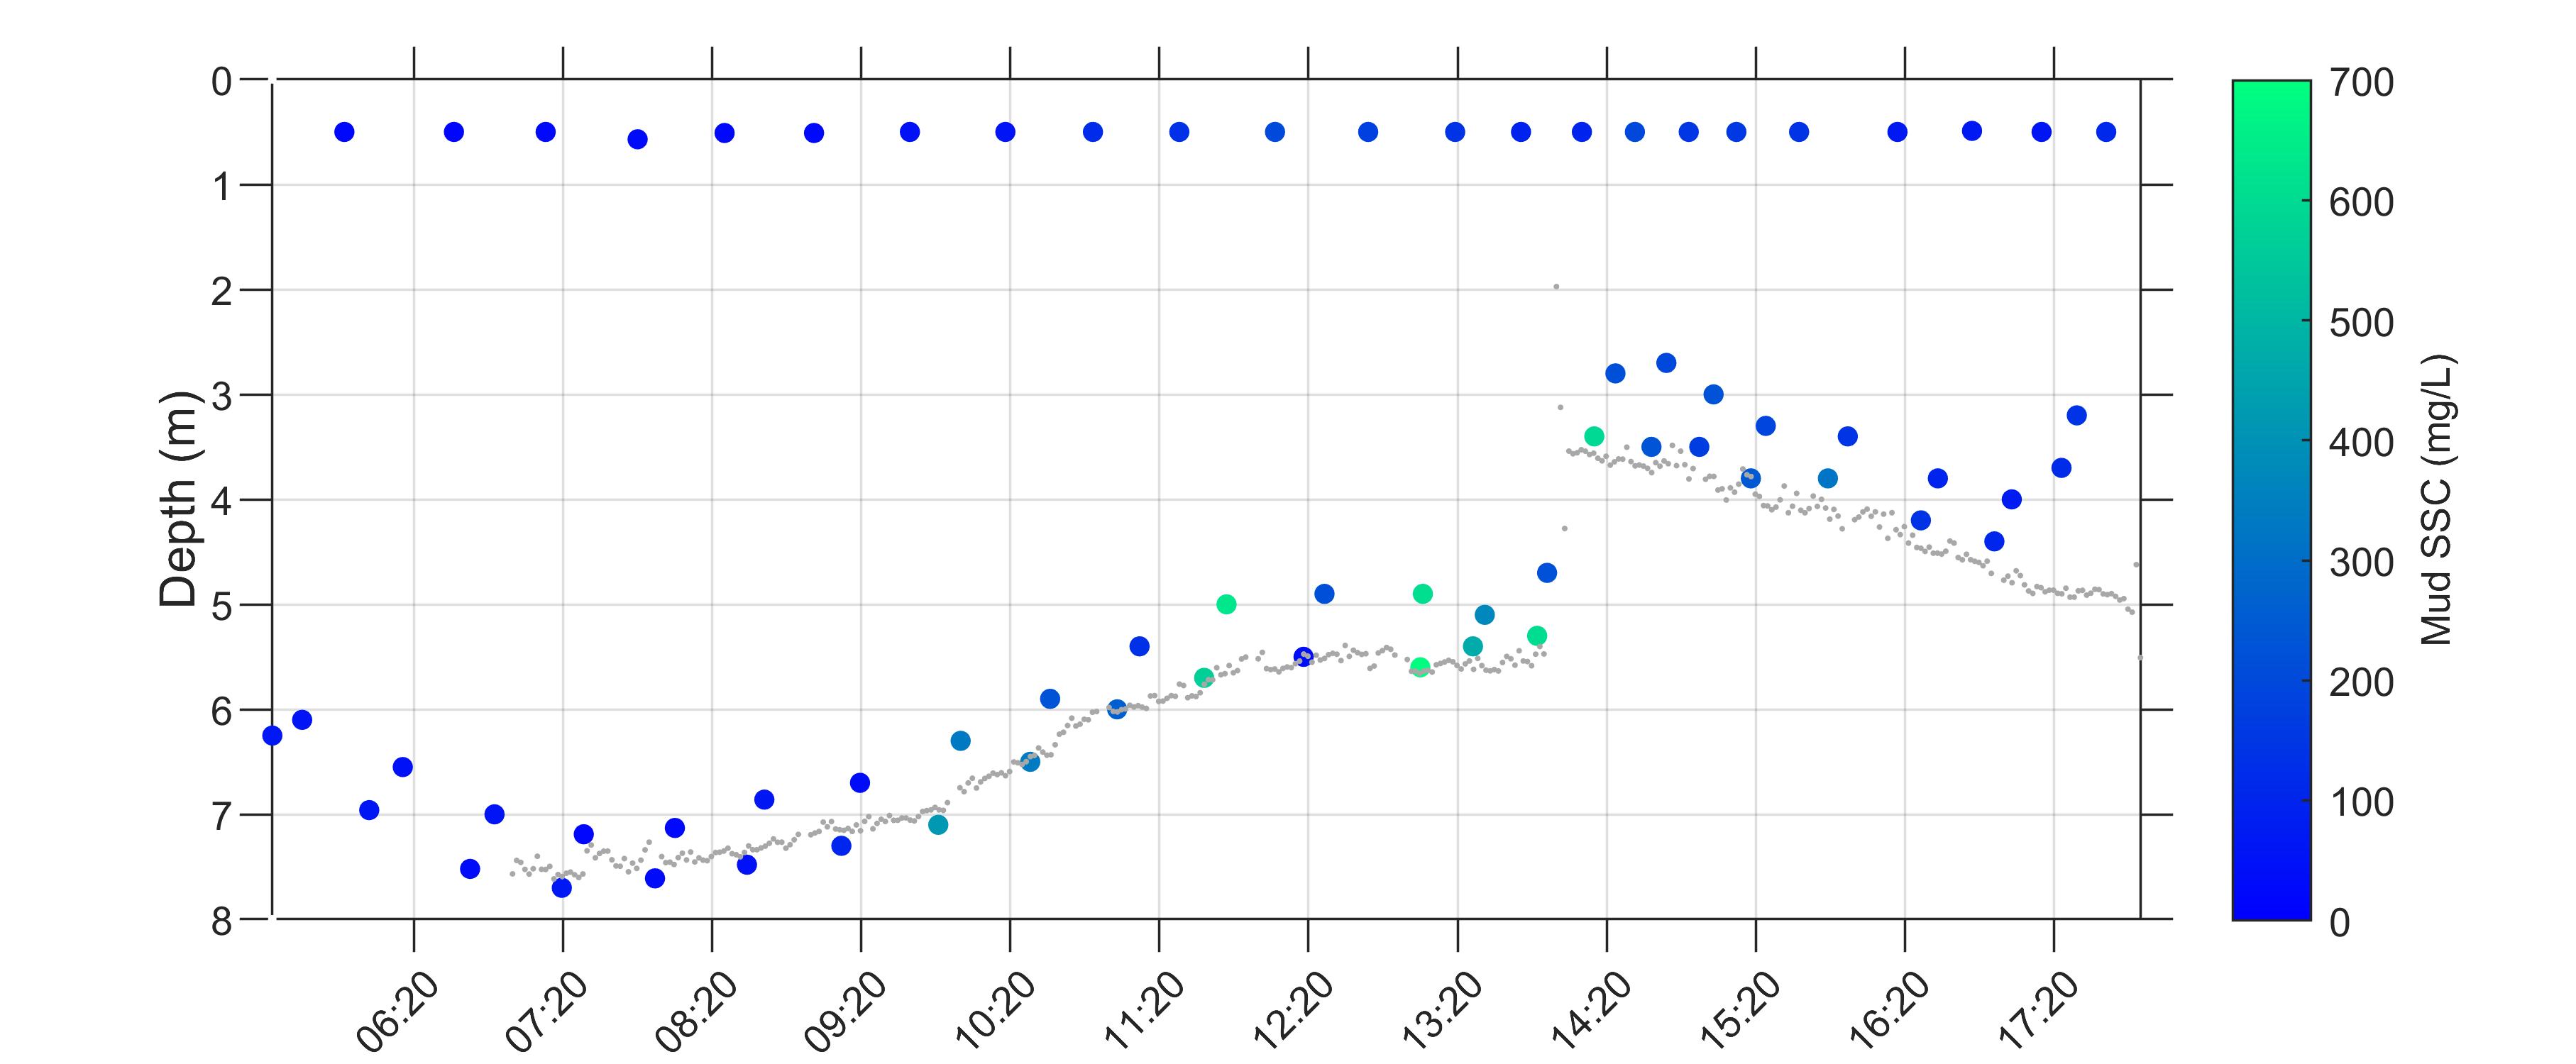
Figure 3 shows a velocity profile from the bottom-mounted Signature 1000. Velocity is heightened in the water column at the onset of the flood tide. Velocities decrease and approach zero as flood tide terminates. The speed increases in the opposite direction during the ebb tide, reaching a peak before approaching zero as the tide turns.
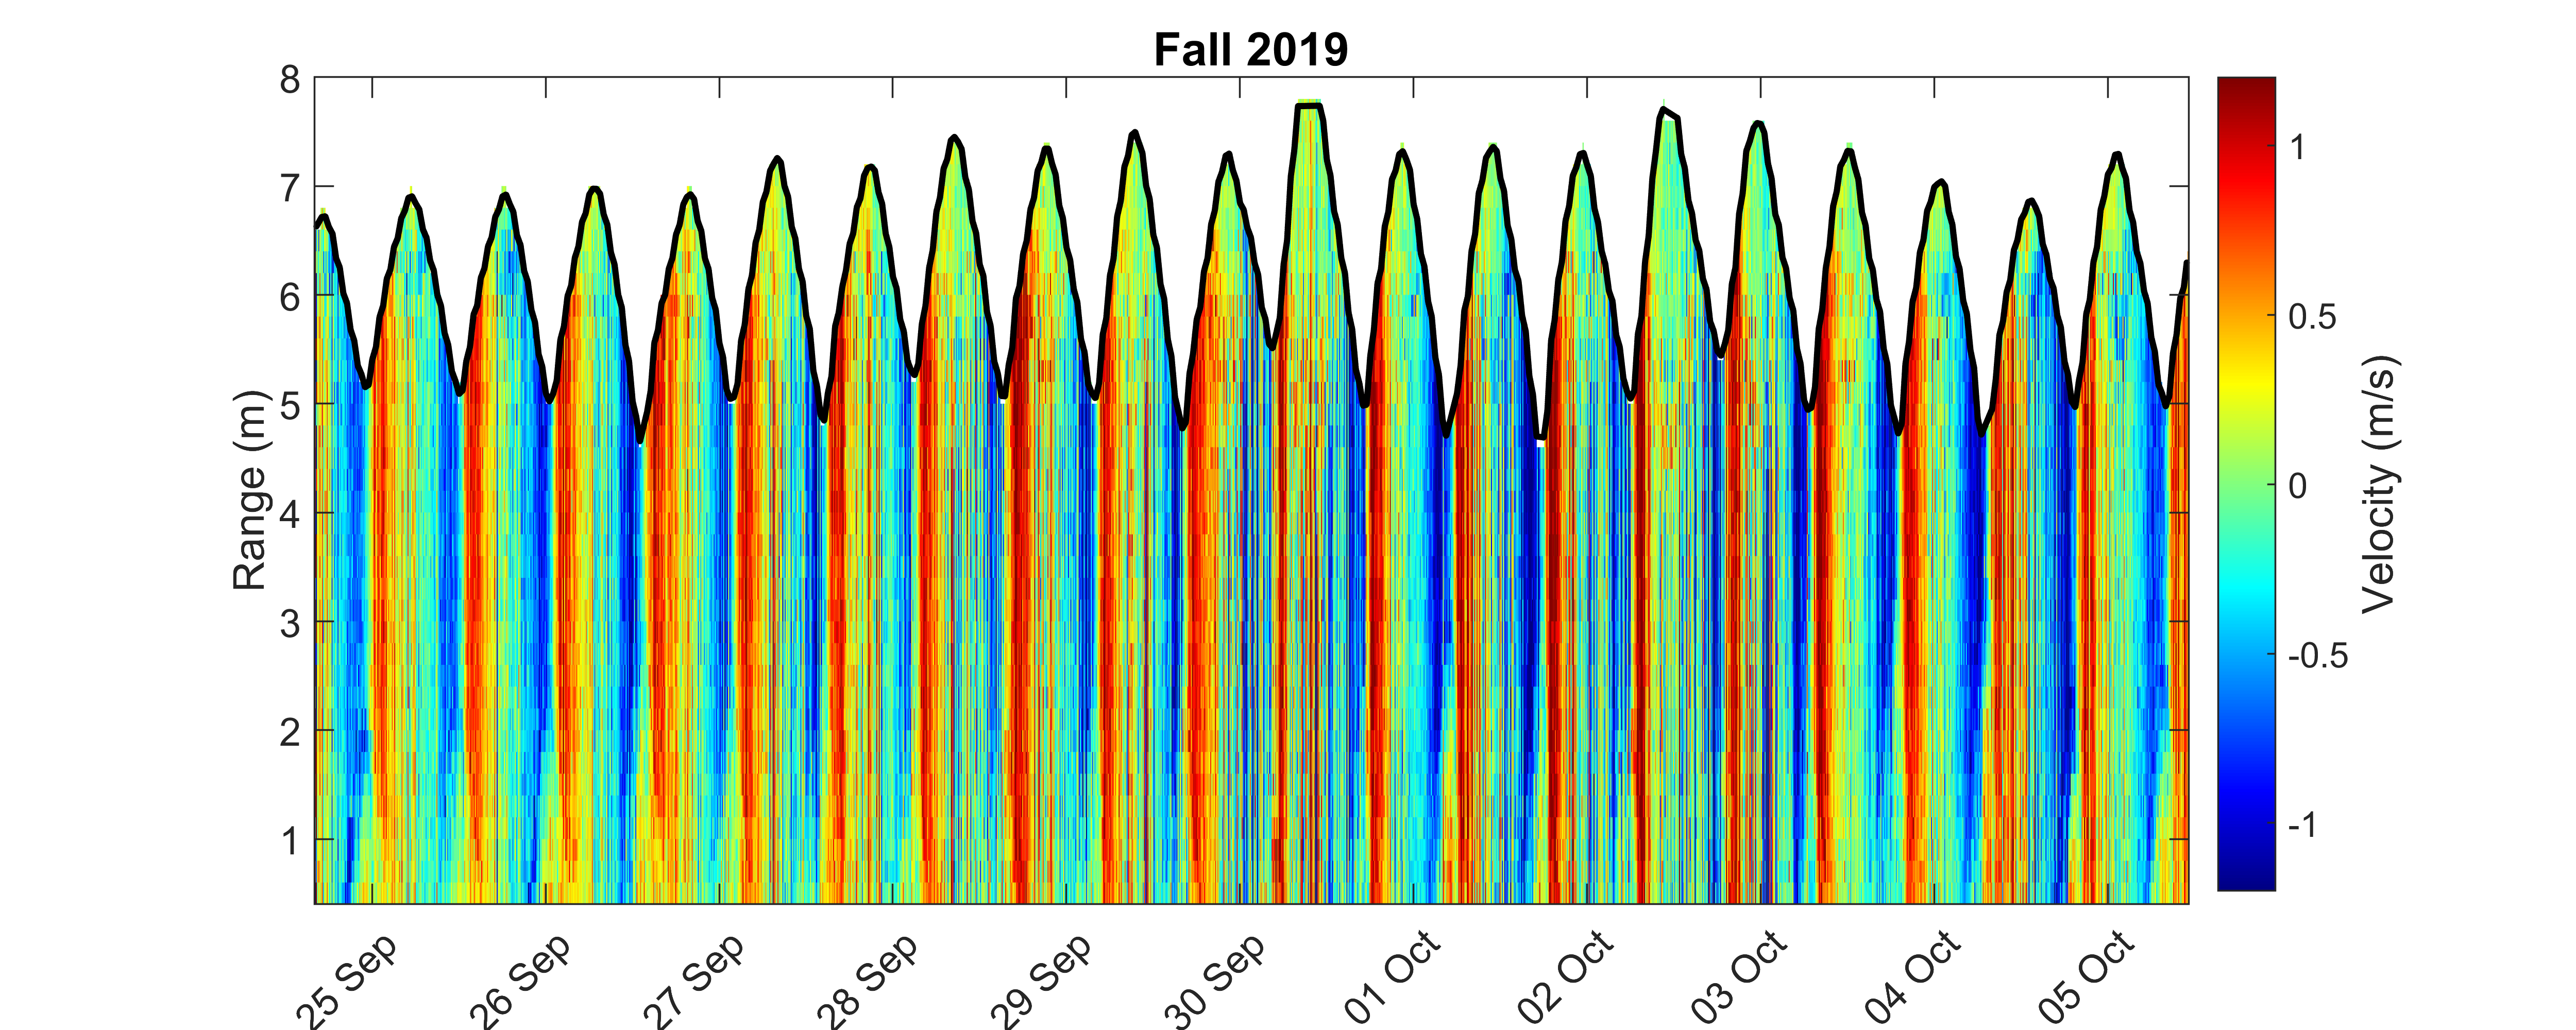
Figure 4 displays an echogram capturing similar tidal dynamics. Low intensities occur with minimal velocities at the turn of flood tide to ebb tide. Intensities are heightened at the surface during low tide.
Why coupling echosounder with velocity data is important
Improving the spatial reach of suspended sediment monitoring and coupling echosounder with velocity data has significant implications for sediment flux computations and associated dredging operations, sand nourishment activities, scour and erosion studies, ecological restoration efforts and adaptive management strategies.
These can be invaluable tools for researchers and engineers to capture and analyze a full picture of the water column from surface to bed at very fine temporal and spatial scales and within larger time frames and regions.
What about biomass measurements?
Although biomass measurements are important for the environmental management of estuarine and coastal ocean systems, the above-mentioned measurement campaign executed by Nortek and WaterProof did not specifically include biomass measurements. However, by incorporating a current profiler and echosounder in one easy-to-install, vessel-mounted instrument, Nortek has developed technology for researchers interested in current profiling and biomass measurements in the upper ocean boundary layer.
Further background can be found in this paper on combined current profiling and biological echosounding results from a single ADCP and in the recorded webinar «Scientific estimates of biomass - a new frontier for ADCPs».